Minimalist IAS
CSAT

UPSC CSE 2018 · Paper II (qualifying, 33%) · Series A

CSAT (GS Paper II) 2018

All 80 questions in UPSC's order, with the official answer key.

What this paper asked, by skill▾

Consider the following three-dimensional figure:
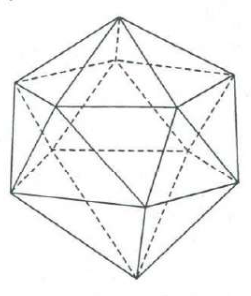
A regular icosahedron drawn as a wire frame, with hidden edges dashed: 12 vertices, 30 edges and triangular faces all round.
From UPSC's question paper.

How many triangles does the above figure have?

Answer & explanation

Answer: (b) 20

The solid is a regular icosahedron, and every one of its faces is a triangle. Its edges close into no triangles other than the faces, so the count is simply the number of faces: 20.

  1. Identify the solid: every face is a triangle and five faces meet at each vertex — a regular icosahedron.
  2. Count the faces in three layers: 5 around the top vertex, 5 around the bottom vertex and a band of 10 in the middle.
  3. 5 + 10 + 5 = 20 triangular faces.
  4. No three edges outside a face close into a triangle, so there are no extra triangles to add.
  5. Check: Euler's formula V − E + F = 2 with 12 vertices and 30 edges gives F = 20.

Remember · For a solid made of triangular faces, count faces layer by layer and confirm with Euler's formula V − E + F = 2.

Question and answer: UPSC's official GS Paper II (2018, Series A) — paper ↗ · answer key ↗. Explanation: Minimalist IAS, checked 1 Oct 2026 (how we verify). Permalink ·
Consider the following sum:

• + 1• + 2• + •3 + •1 = 21•

In the above sum, • stands for

Answer & explanation

Answer: (d) 8

Treat • as one digit x and write every term by place value. The equation 23x + 34 = 210 + x gives x = 8.

  1. Let • = x. Then 1• = 10 + x, 2• = 20 + x, •3 = 10x + 3, •1 = 10x + 1 and 21• = 210 + x.
  2. Left side: x + (10 + x) + (20 + x) + (10x + 3) + (10x + 1) = 23x + 34.
  3. 23x + 34 = 210 + x, so 22x = 176 and x = 8.
  4. Check: 8 + 18 + 28 + 83 + 81 = 218, which is 21• with • = 8.

Remember · Write each symbol-number by place value (tens digit × 10 + units digit), then solve one linear equation.

Question and answer: UPSC's official GS Paper II (2018, Series A) — paper ↗ · answer key ↗. Explanation: Minimalist IAS, checked 30 Sept 2026 (how we verify). Permalink ·

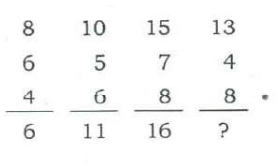
Consider the following pattern of numbers:

8101513
6574
4688
61116?
Four columns of three numbers, each ruled off with a result below it: 8, 6, 4 → 6; 10, 5, 6 → 11; 15, 7, 8 → 16; 13, 4, 8 → ?.
From UPSC's question paper.

What is the number at? in the above pattern?

Answer & explanation

Answer: (a) 17

In each column the result is the first number plus the third minus the second: 8 + 4 − 6 = 6, 10 + 6 − 5 = 11 and 15 + 8 − 7 = 16. The last column gives 13 + 8 − 4 = 17.

  1. Column 1: 8 + 4 − 6 = 6. Column 2: 10 + 6 − 5 = 11. Column 3: 15 + 8 − 7 = 16.
  2. The same rule — top + bottom − middle — fits all three complete columns.
  3. Column 4: 13 + 8 − 4 = 17.

Remember · In column puzzles, try simple combinations (+, −, ×) of the entries on every complete column before filling the gap.

Question and answer: UPSC's official GS Paper II (2018, Series A) — paper ↗ · answer key ↗. Explanation: Minimalist IAS, checked 1 Oct 2026 (how we verify). Permalink ·
How many diagonals can be drawn by joining the vertices of an octagon?

Answer & explanation

Answer: (a) 20

Any two of the 8 vertices can be joined in C(8, 2) = 28 ways. Eight of those joins are the sides, so 20 are diagonals.

  1. Lines joining two vertices: C(8, 2) = 8 × 7 ÷ 2 = 28.
  2. Of these, 8 are sides of the octagon.
  3. Diagonals = 28 − 8 = 20.
  4. Check with the formula n(n − 3)/2 = 8 × 5 ÷ 2 = 20.

Remember · Diagonals of an n-sided polygon = n(n − 3)/2: each vertex joins n − 3 non-adjacent vertices, and each diagonal is counted twice.

Question and answer: UPSC's official GS Paper II (2018, Series A) — paper ↗ · answer key ↗. Explanation: Minimalist IAS, checked 30 Sept 2026 (how we verify). Permalink ·

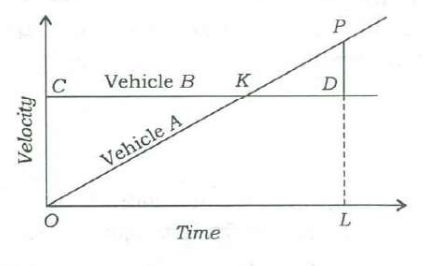
The figure drawn below gives the velocity graphs of two vehicles A and B. The straight line OKP represents the velocity of vehicle A at any instant, whereas the horizontal straight line CKD represents the velocity of vehicle B at any instant. In the figure, D is the point where perpendicular from P meets the horizontal line CKD such that PD = 1/2 LD:

Velocity–time graph: A's velocity rises along a straight line from the origin O through K to P; B's velocity is the horizontal line C–K–D; P lies above time L, D is on B's line directly below P, and PL is dotted down to the time axis.
From UPSC's question paper.

What is the ratio between the distances covered by vehicles A and B in the time interval OL?

Answer & explanation

Answer: (c) 3: 4

Distance is the area under a velocity–time graph. A's distance is the triangle OLP and B's is the rectangle of height LD over OL; since PL = 3/2 × LD, the triangle is 3/4 of the rectangle.

  1. Let LD (B's constant velocity) = 2 units; then PD = 1 and A's velocity at time L is PL = PD + DL = 3.
  2. Distance of B in time OL = rectangle = OL × 2 = 2 × OL.
  3. Distance of A in time OL = triangle OLP = 1/2 × OL × 3 = 1.5 × OL.
  4. Ratio A : B = 1.5 : 2 = 3 : 4.

Remember · On a velocity–time graph, distance = area under the line: a triangle for steady acceleration from rest, a rectangle for constant speed.

Question and answer: UPSC's official GS Paper II (2018, Series A) — paper ↗ · answer key ↗. Explanation: Minimalist IAS, checked 1 Oct 2026 (how we verify). Permalink ·
A train 200 metres long is moving at the rate of 40 kmph. In how many seconds will it cross a man standing near the railway line?

Answer & explanation

Answer: (d) 18

To pass a man standing still, the train covers only its own length, 200 m. At 40 km/h, which is 100/9 m/s, that takes 18 seconds.

  1. Distance to cover = length of the train = 200 m (the man adds no length).
  2. Speed: 40 km/h = 40 × 5/18 = 100/9 m/s.
  3. Time = 200 ÷ (100/9) = 18 seconds.
  4. Check: in 18 s at 40 km/h the train covers 40,000 × 18 ÷ 3600 = 200 m.

Remember · A train passing a pole or a standing person covers only its own length; convert km/h to m/s by multiplying by 5/18.

Question and answer: UPSC's official GS Paper II (2018, Series A) — paper ↗ · answer key ↗. Explanation: Minimalist IAS, checked 30 Sept 2026 (how we verify). Permalink ·

Directions for the following 4 (four) items: Read the following four passages and answer the items that follow. Your answers to these items should be based on the passages only.

Passage—1

Global population was around 1.6 billion in 1990—today it is around 7.2 billion and growing. Recent estimates on population growth predict a global population of 9.6 billion in 2050 and 10.9 billion in 2100. Unlike Europe and North America, where only three to four per cent of population is engaged in agriculture, around 47 per cent of India’s population is dependent upon agriculture. Even if India continues to do well in the service sector and the manufacturing sector picks up, it is expected that around 2030 when India overtakes China as the world’s most populous country, nearly 42 per cent of India’s population will still be predominantly dependent on agriculture.

Which of the following is the most logical and rational inference that can be made from the above passage?

Answer & explanation

Answer: (a) Prosperity of agriculture sector is of critical importance to India.

The passage's point is that around 47 per cent of Indians depend on agriculture today and nearly 42 per cent will still do so in 2030, even if services and manufacturing grow. When so many livelihoods hang on one sector, its prosperity is critical to India.

  • ✓ (a) Follows directly: with close to half the population dependent on farming now and in 2030, how well agriculture does decides the well-being of a huge share of Indians.
  • ✗ (b) The passage speaks of people dependent on agriculture, not of agriculture's share of the economy; many people depending on a sector is not the same as the economy depending greatly on it.
  • ✗ (c) The population figures are background; the passage proposes no population policy, let alone 'strict measures'.
  • ✗ (d) The passage expects many to remain in farming even as other sectors grow; it gives no advice to farmers to change occupations.

Remember · Pick the inference that follows from the passage's central fact; reject options that add a policy the author never proposes.

Question and answer: UPSC's official GS Paper II (2018, Series A) — paper ↗ · answer key ↗. Explanation: Minimalist IAS, checked 30 Sept 2026 (how we verify). Permalink ·

Passage—2

Many pathogens that cause foodborne illnesses are unknown. Food contamination can occur at any stage from farm to plate. Since most cases of food poisoning go unreported, the true extent of global foodborne illnesses is unknown. Improvements in international monitoring have led to greater public awareness, yet the rapid globalization of food production increases consumers’ vulnerability by making food harder to regulate and trace. “We have the world on our plates”, says an official of WHO.

Which of the following is the most logical corollary to the above passage?

Answer & explanation

Answer: (a) With more options for food come more risks.

The passage says the rapid globalization of food production raises consumers' vulnerability because food becomes harder to regulate and trace — 'We have the world on our plates'. Food from everywhere means more choice and, with it, more risk.

  • ✓ (a) Food drawn from across the world ('the world on our plates') widens choice, and the passage says this same globalization makes food harder to trace and consumers more vulnerable.
  • ✗ (b) Contamination can happen 'at any stage from farm to plate'; processing is not singled out, and 'all' is too sweeping.
  • ✗ (c) A prescription the passage never makes; it describes a risk without asking people to eat only local food.
  • ✗ (d) The passage notes the risk of globalized food production but does not call for curbing it.

Remember · A corollary is a direct consequence of the passage's claim; drop options that turn a described risk into a policy demand.

Question and answer: UPSC's official GS Paper II (2018, Series A) — paper ↗ · answer key ↗. Explanation: Minimalist IAS, checked 30 Sept 2026 (how we verify). Permalink ·

Passage—3

I am a scientist, privileged to be somebody who tries to understand nature using the tools of science. But it is also clear that there are some really important questions that science cannot really answer, such as: Why is there something instead of nothing? Why are we here? In those domains, I have found that faith provides a better path to answers. I find it oddly anachronistic that in today’s culture there seems to be a widespread presumption that scientific and spiritual views are incompatible.

Which of the following is the most logical and rational inference that can be made from the above passage?

Answer & explanation

Answer: (b) Science and faith can be mutually complementary if their proper domains are understood.

The author uses science to understand nature and turns to faith for questions science cannot answer, and finds the belief that the two are incompatible oddly out of date. The inference is that each has its own domain, and seen that way they complement each other.

  • ✗ (a) Too extreme: faith is a better path only 'In those domains', the questions science cannot answer; the author never says faith can solve all of mankind's problems.
  • ✓ (b) One person practises science for nature and relies on faith for questions like 'Why are we here?'; the author rejects the presumption that the two are incompatible.
  • ✗ (c) The author says faith 'provides a better path to answers' for these questions, so they are not beyond both.
  • ✗ (d) The passage mentions a presumption of incompatibility, not that science is valued above spirituality.

Remember · Watch for 'all', 'only' and 'neither'; the right inference keeps the author's limits, such as 'in those domains'.

Question and answer: UPSC's official GS Paper II (2018, Series A) — paper ↗ · answer key ↗. Explanation: Minimalist IAS, checked 30 Sept 2026 (how we verify). Permalink ·

Passage—4

Though I have discarded much of past tradition and custom, and am anxious that India should rid herself of all shackles that bind and contain her and divide her people, and suppress vast numbers of them, and prevent the free development of the body and the spirit; though I seek all this, yet I do not wish to cut myself off from that past completely. I am proud of that great inheritance that has been and is, ours and I am conscious that I too, like all of us, am a link in that unbroken chain which goes back to the dawn of history in the immemorial past of India.

The author wants India to rid herself of certain past bonds because

Answer & explanation

Answer: (d) they obstruct her physical and spiritual growth

The author wants India free of shackles that bind and divide her people, suppress vast numbers of them and 'prevent the free development of the body and the spirit'. That reason is option (d); everywhere else he speaks of pride in the past.

  • ✗ (a) He sees the past as relevant: he does not wish to cut himself off from it and calls himself a link in an unbroken chain.
  • ✗ (b) Contradicts the passage: 'I am proud of that great inheritance'.
  • ✗ (c) His sense of belonging to a chain going back to 'the dawn of history' shows deep interest in India's history.
  • ✓ (d) Stated in the passage: the shackles 'prevent the free development of the body and the spirit' — physical and spiritual growth.

Remember · For a 'because' question, find the reason clause in the passage itself; options contradicting the author's stated feelings fall away.

Question and answer: UPSC's official GS Paper II (2018, Series A) — paper ↗ · answer key ↗. Explanation: Minimalist IAS, checked 30 Sept 2026 (how we verify). Permalink ·

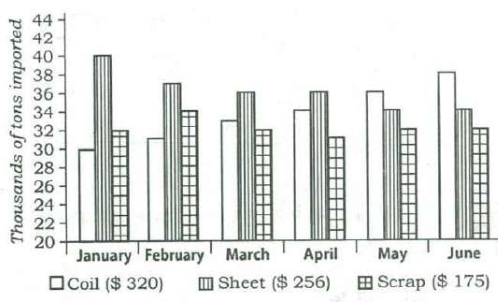
Directions for the following 3 (three) items: The following three items are based on the graph given below which shows imports of three different types of steel over a period of six months of a year. Study the graph and answer the three items that follow.

The figures in the brackets indicate the average cost per ton over six months period.

MonthCoil ($ 320)Sheet ($ 256)Scrap ($ 175)
January304032
February313734
March333632
April343631
May363432
June383432
Bar chart of steel imports (thousands of tons, axis 20 to 44) for January to June, with bars for coil, sheet and scrap each month; the table gives the bar heights read from the chart.
From UPSC's question paper.

By how much (measured in thousands of tons) did the import of sheet steel exceed the import of coil steel in the first three months of the year?

Answer & explanation

Answer: (c) 19

Add the January–March bars: sheet 40 + 37 + 36 = 113 and coil 30 + 31 + 33 = 94 thousand tons. Sheet exceeds coil by 19 thousand tons.

  1. Sheet, January–March: 40 + 37 + 36 = 113 thousand tons.
  2. Coil, January–March: 30 + 31 + 33 = 94 thousand tons.
  3. Excess = 113 − 94 = 19.
  4. Check month by month: 10 + 6 + 3 = 19.

Remember · For a total difference over several months, add the month-by-month gaps; it is quicker and cross-checks the totals.

Question and answer: UPSC's official GS Paper II (2018, Series A) — paper ↗ · answer key ↗. Explanation: Minimalist IAS, checked 1 Oct 2026 (how we verify). Permalink ·
Directions for the following 3 (three) items: The following three items are based on the graph given below which shows imports of three different types of steel over a period of six months of a year. Study the graph and answer the three items that follow.

The figures in the brackets indicate the average cost per ton over six months period.

MonthCoil ($ 320)Sheet ($ 256)Scrap ($ 175)
January304032
February313734
March333632
April343631
May363432
June383432

Uses the same figure as Q11 ↑

What was the approximate total value (in $) of sheet steel imported over the six months period?

Answer & explanation

Answer: (c) 55,550

Sheet imports over the six months total 217 thousand tons; at the average $256 a ton that is 55,552 — nearest to 55,550. Because the tonnage is in thousands, the value is in thousands of dollars too.

  1. Sheet imports: 40 + 37 + 36 + 36 + 34 + 34 = 217 thousand tons.
  2. Value = 217 × 256 = 55,552 (thousand $), using the average cost of $256 per ton.
  3. Nearest option: 55,550.
  4. Check: 217 × 256 is close to 220 × 250 = 55,000, which rules out 45,555, 50,555 and 65,750.

Remember · Total value = total quantity × average price; keep the units (here thousands) in mind and round to eliminate far-off options.

Question and answer: UPSC's official GS Paper II (2018, Series A) — paper ↗ · answer key ↗. Explanation: Minimalist IAS, checked 1 Oct 2026 (how we verify). Permalink ·
Directions for the following 3 (three) items: The following three items are based on the graph given below which shows imports of three different types of steel over a period of six months of a year. Study the graph and answer the three items that follow.

The figures in the brackets indicate the average cost per ton over six months period.

MonthCoil ($ 320)Sheet ($ 256)Scrap ($ 175)
January304032
February313734
March333632
April343631
May363432
June383432

Uses the same figure as Q11 ↑

What was the approximate ratio of sheet steel and scrap steel imports in the first three months of the year?

Answer & explanation

Answer: (b) 1.2: 1

In January–March, sheet imports total 113 and scrap imports 32 + 34 + 32 = 98 thousand tons. 113 ÷ 98 is about 1.15, which is closest to 1.2 : 1.

  1. Sheet, January–March: 40 + 37 + 36 = 113.
  2. Scrap, January–March: 32 + 34 + 32 = 98.
  3. 113 ÷ 98 ≈ 1.15, so the ratio is about 1.2 : 1.
  4. Check: 1.4 : 1 would need sheet near 137, and 1 : 1 would need equal totals — neither fits.

Remember · For an approximate ratio, divide the two totals once and choose the nearest option.

Question and answer: UPSC's official GS Paper II (2018, Series A) — paper ↗ · answer key ↗. Explanation: Minimalist IAS, checked 1 Oct 2026 (how we verify). Permalink ·
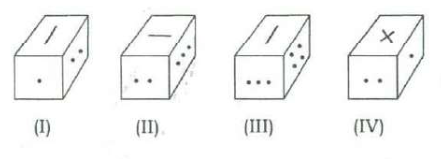
Directions for the following 3 (three) items: Rotated positions of a single solid are shown below. The various faces of the solid are marked with different symbols like dots, cross and line. Answer the three items that follow the given figures.

Four views (I)–(IV) of one rectangular block, each showing its top, front and right faces: (I) line, one dot, two dots; (II) line, two dots, three dots; (III) line, three dots, four dots; (IV) cross, two dots, one dot.
From UPSC's question paper.

What is the symbol on the face opposite to that containing a single dot?

Answer & explanation

Answer: (b) Three dots

The line is on top in views (I)–(III), so the four dot-faces all touch it and form the ring around the solid, and the cross, the sixth face, is opposite the line. Around the ring the order is one, two, three, four dots, so one dot is opposite three dots.

  1. Views (I)–(III) all have the line on top and between them show one, two, three and four dots on the sides: all four dot-faces touch the line.
  2. The only face left, the cross, must be opposite the line.
  3. Side faces in order: (I) one then two; (II) two then three; (III) three then four — the ring runs 1, 2, 3, 4.
  4. In a ring of four faces, alternate faces are opposite: one dot is opposite three dots (and two dots opposite four dots).
  5. Check with (IV): cross on top, two dots in front, one dot on the right — one and two dots are adjacent, as the ring requires.

Remember · A face seen beside four different faces is opposite the sixth; the other four then form a ring in which alternate faces are opposite.

Question and answer: UPSC's official GS Paper II (2018, Series A) — paper ↗ · answer key ↗. Explanation: Minimalist IAS, checked 1 Oct 2026 (how we verify). Permalink ·
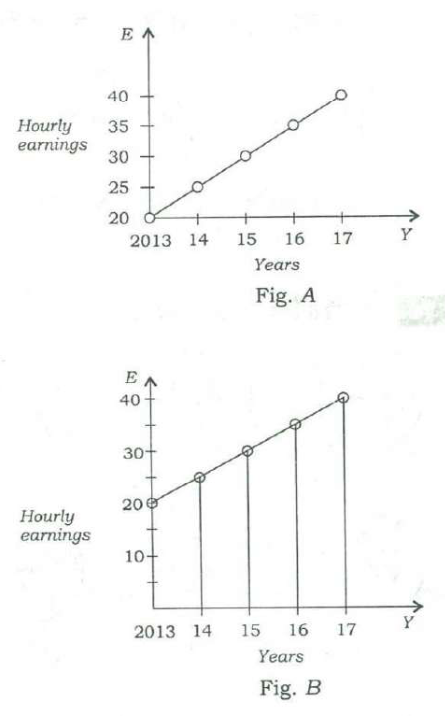
Directions for the following 3 (three) items: Rotated positions of a single solid are shown below. The various faces of the solid are marked with different symbols like dots, cross and line. Answer the three items that follow the given figures.

Uses the same figure as Q14 ↑

What is the symbol on the face opposite to that containing two dots?

Answer & explanation

Answer: (c) Four dots

Two dots is seen next to one dot, three dots, the line and the cross, but never next to four dots. The face it never touches — four dots — is its opposite.

  1. Faces seen beside two dots: one dot (I, IV), three dots (II), the line (II) and the cross (IV).
  2. That is four of the five other faces; four dots never appears with two dots.
  3. So four dots is opposite two dots.
  4. Check: the ring of side faces runs 1, 2, 3, 4, and alternate faces of a ring of four are opposite.

Remember · The opposite face is the one never seen together with the given face in any of the views.

Question and answer: UPSC's official GS Paper II (2018, Series A) — paper ↗ · answer key ↗. Explanation: Minimalist IAS, checked 1 Oct 2026 (how we verify). Permalink ·
Directions for the following 3 (three) items: Rotated positions of a single solid are shown below. The various faces of the solid are marked with different symbols like dots, cross and line. Answer the three items that follow the given figures.

Uses the same figure as Q14 ↑

What is the symbol on the face opposite to that containing the cross?

Answer & explanation

Answer: (c) Line

The line is seen beside one, two, three and four dots across views (I)–(III). The only face it never touches is the cross, so the cross is opposite the line.

  1. Faces beside the line: one and two dots (I), two and three dots (II), three and four dots (III).
  2. That covers four of the five other faces; the cross never appears with the line.
  3. So the cross is opposite the line.
  4. Check with (IV): with the cross on top, dot-faces fill the sides, as expected for the face opposite the line.

Remember · A face that appears next to four others is opposite the sixth — the quickest opposite-face test for dice and blocks.

Question and answer: UPSC's official GS Paper II (2018, Series A) — paper ↗ · answer key ↗. Explanation: Minimalist IAS, checked 1 Oct 2026 (how we verify). Permalink ·
Directions for the following 4 (four) items: Read the following passage and answer the four items that follow. Your answers to these items should be based on the passage only.

Passage

It is no longer enough for us to talk about providing for universal access to education. Making available schooling facilities is an essential prerequisite, but is insufficient to ensure that all children attend school and participate in the learning process. The school may be there, but children may not attend or they may drop out after a few months. Through school and social mapping, we must address the entire gamut of social, economic, cultural and indeed linguistic and pedagogic issues, factors that prevent children from weaker sections and disadvantaged groups, as also girls, from regularly attending and complementing elementary education. The focus must be on the poorest and most vulnerable since these groups are the most disempowered and at the greatest risk of violation or denial of their right to education.

The right to education goes beyond free and compulsory education to include quality education for all. Quality is an integral part of the right to education. If the education process lacks quality, children are being denied their right. The Right of Children to Free and Compulsory Education Act lays down that the curriculum should provide for learning through activities, exploration and discovery. This places an obligation on us to change our perception of children as passive receivers of knowledge, and to move beyond the convention of using textbooks as the basis of examinations. The teaching-learning process must become stress-free; and a massive programme for curricular reform should be initiated to provide for a child-friendly learning system, that is more relevant and empowering. Teacher accountability systems and processes must ensure that children are learning, and that their right to learn in a child-friendly environment is not violated. Testing and assessment systems must be reexamined and redesigned to ensure that these do not force children to struggle between school and tuition centres, and bypass childhood.

According to the passage, which of the following is/are of paramount importance under the Right to Education?

  1. 1.Sending of children to school by all parents
  2. 2.Provision of adequate physical infrastructure in schools
  3. 3.Curricular reforms for developing child-friendly learning system

Select the correct answer using the code given below.

Answer & explanation

Answer: (c) 3 only

The passage calls schooling facilities 'an essential prerequisite, but … insufficient', and says quality is integral to the right, calling for 'a massive programme for curricular reform' for a child-friendly learning system. Only statement 3 is presented as central.

  • ✗ 1. Parents are never mentioned; the passage speaks of social, economic and cultural factors that keep children away, not of parents sending them.
  • ✗ 2. Facilities are necessary but 'insufficient'; the passage deliberately moves the focus away from infrastructure.
  • ✓ 3. Quality is 'an integral part of the right to education', and a massive curricular reform for 'a child-friendly learning system' is demanded.

Remember · What the passage calls 'necessary but insufficient' is not the paramount factor; look for what the author insists must change.

Question and answer: UPSC's official GS Paper II (2018, Series A) — paper ↗ · answer key ↗. Explanation: Minimalist IAS, checked 30 Sept 2026 (how we verify). Permalink ·

With reference to the above passage, the following assumptions have been made:

  1. 1.The Right to Education guarantees teachers’ accountability for the learning process of children.
  2. 2.The Right to Education guarantees 100% enrolment of children in the schools.
  3. 3.The Right to Education intends to take full advantage of demographic dividend.

Which of the above assumptions is/are valid?

Answer & explanation

Answer: (a) 1 only

The passage builds teacher accountability into the right to quality education: accountability systems 'must ensure that children are learning'. It never promises full enrolment — it warns children may not attend — and never mentions the demographic dividend.

  • ✓ 1. Quality is part of the right, and 'Teacher accountability systems and processes must ensure that children are learning' — accountability for learning flows from the right as the passage describes it.
  • ✗ 2. The passage says the opposite: the school may be there but children 'may not attend or they may drop out', so no guarantee of 100% enrolment is assumed.
  • ✗ 3. Demographic dividend is outside the passage, which is concerned with children's rights, quality and childhood, not the economic use of population.

Remember · An assumption must be needed by the author's argument; ideas the passage never touches, like demographic dividend, are invalid.

Question and answer: UPSC's official GS Paper II (2018, Series A) — paper ↗ · answer key ↗. Explanation: Minimalist IAS, checked 30 Sept 2026 (how we verify). Permalink ·

According to the passage, which one of the following is critical in bringing quality in education?

Answer & explanation

Answer: (d) Inculcating learning through activities and discovery

Right after saying quality is integral to the right to education, the passage cites the Act: the curriculum should provide for 'learning through activities, exploration and discovery'. That is its route to quality.

  • ✗ (a) Children's attendance is discussed under access, not quality; teachers' attendance is not mentioned.
  • ✗ (b) Pay or incentives for teachers appear nowhere in the passage.
  • ✗ (c) Social and cultural factors come up in the first paragraph as reasons children stay away — an access issue, not the quality discussion.
  • ✓ (d) The quality paragraph says the curriculum should provide for 'learning through activities, exploration and discovery' and asks us to stop treating children as passive receivers.

Remember · Match the option to the paragraph that answers the question; here access and quality are discussed in separate paragraphs.

Question and answer: UPSC's official GS Paper II (2018, Series A) — paper ↗ · answer key ↗. Explanation: Minimalist IAS, checked 30 Sept 2026 (how we verify). Permalink ·

What is the essential message in this passage?

Answer & explanation

Answer: (c) The Right to Free and Compulsory Education should include quality education for all.

The passage opens by saying access is no longer enough and builds to its thesis: 'The right to education goes beyond free and compulsory education to include quality education for all.' The essential message is quality, not mere enrolment.

  • ✗ (a) A fact from outside the passage; the constitutional status of the right is never discussed.
  • ✗ (b) The passage stresses that children of weaker sections may still stay away even where schools exist — which is why more than access is needed.
  • ✓ (c) Quality is 'an integral part of the right to education', and without it children 'are being denied their right'.
  • ✗ (d) Attendance is one point in the first paragraph, and the passage never assigns this duty to the Government and parents.

Remember · The essential message is the claim the whole passage builds towards — often a 'not just X but also Y' idea, here quality beyond access.

Question and answer: UPSC's official GS Paper II (2018, Series A) — paper ↗ · answer key ↗. Explanation: Minimalist IAS, checked 30 Sept 2026 (how we verify). Permalink ·

If LSJXVC is the code for MUMBAI, the code for DELHI is

Answer & explanation

Answer: (a) CCIDD

Each letter of MUMBAI is moved back by 1, 2, 3, 4, 5 and 6 places in turn, wrapping from A round to Z. Moving the letters of DELHI back by 1 to 5 gives CCIDD.

  1. M − 1 = L, U − 2 = S, M − 3 = J, B − 4 = X (B → A → Z → Y → X), A − 5 = V, I − 6 = C.
  2. DELHI: D − 1 = C, E − 2 = C, L − 3 = I, H − 4 = D, I − 5 = D.
  3. Code: CCIDD.
  4. Check: (d) CCIFE agrees in the first three letters but fails at H − 4 = D.

Remember · In letter codes, write the shift for each position; a growing shift (−1, −2, −3 …) is common, and letters wrap from A to Z.

Question and answer: UPSC's official GS Paper II (2018, Series A) — paper ↗ · answer key ↗. Explanation: Minimalist IAS, checked 30 Sept 2026 (how we verify). Permalink ·

If RAMON is written as 12345 and DINESH as 675849, then HAMAM will be written as

Answer & explanation

Answer: (b) 92323

Each letter stands for a fixed digit. From the two words, H = 9, A = 2 and M = 3, so HAMAM reads 9-2-3-2-3.

  1. RAMON = 12345: R = 1, A = 2, M = 3, O = 4, N = 5.
  2. DINESH = 675849: D = 6, I = 7, N = 5, E = 8, S = 4, H = 9.
  3. HAMAM = H, A, M, A, M = 9, 2, 3, 2, 3 = 92323.

Remember · For letter-to-digit codes, map each letter once and read the new word letter by letter; repeated letters repeat their digit.

Question and answer: UPSC's official GS Paper II (2018, Series A) — paper ↗ · answer key ↗. Explanation: Minimalist IAS, checked 30 Sept 2026 (how we verify). Permalink ·

If X is between −3 and −1, and Y is between −1 and 1, then X² − Y² is in between which of the following?

Answer & explanation

Answer: (d) 0 and 9

Squaring removes the signs: X² lies between 1 and 9, and Y² between 0 and 1. So X² − Y² is more than 1 − 1 = 0 and less than 9 − 0 = 9.

  1. −3 < X < −1 gives 1 < X² < 9.
  2. −1 < Y < 1 gives 0 ≤ Y² < 1.
  3. Smallest value of X² − Y²: just above 1 − 1 = 0. Largest: just below 9 − 0 = 9.
  4. So X² − Y² lies between 0 and 9.
  5. Check: X = −2.9 and Y = 0 give 8.41, more than 8, so (c) is too narrow.

Remember · For the range of a difference, pair the largest first term with the smallest second term and vice versa; square before combining.

Question and answer: UPSC's official GS Paper II (2018, Series A) — paper ↗ · answer key ↗. Explanation: Minimalist IAS, checked 30 Sept 2026 (how we verify). Permalink ·

X and Y are natural numbers other than 1, and Y is greater than X. Which of the following represents the largest number?

Answer & explanation

Answer: (a) XY

With X at least 2, the product XY is at least 2Y, while Y/X is at most Y/2, X/Y is below 1 and (X + Y)/XY is below 1. XY is always the largest.

  1. Try the smallest values X = 2, Y = 3: XY = 6, X/Y ≈ 0.67, Y/X = 1.5, (X + Y)/XY = 5/6.
  2. In general X ≥ 2, so XY ≥ 2Y > Y > Y/X.
  3. X/Y < 1 because Y > X, and (X + Y)/XY = 1/X + 1/Y ≤ 1/2 + 1/3 < 1.
  4. So XY is the largest.

Remember · For 'which is largest' under conditions, test the smallest allowed values first, then confirm with a general inequality.

Question and answer: UPSC's official GS Paper II (2018, Series A) — paper ↗ · answer key ↗. Explanation: Minimalist IAS, checked 30 Sept 2026 (how we verify). Permalink ·

Directions for the following 2 (two) items: Read the following information and answer the two items that follow.

The plan of an office block for six officers A, B, C, D, E and F is as follows: Both B and C occupy offices to the right of the corridor (as one enters the office block) and A occupies on the left of the corridor. E and F occupy offices on opposite sides of the corridor but their offices do not face each other. The offices of C and D face each other. E does not have a corner office. F’s office is further down the corridor than A’s, but on the same side.

If E sits in his office and faces the corridor, whose office is to his left?

Answer & explanation

Answer: (c) C

The offices, from the entrance, are D, A, F on the left and C, E, B on the right. Sitting in the middle office on the right and facing the corridor, E has the entrance end on his left — and C's office is there.

  1. Sides: B and C are on the right, A on the left. D faces C, so D is on the left; F is on A's side, so F is on the left, and E is on the right.
  2. Each side has three offices. E has no corner office, so E is in the middle office on the right.
  3. F does not face E, so F is not in the middle; F is further down than A, so F has the far-end office on the left.
  4. D must face C; the middle office on the right is E's, so C and D take the offices nearest the entrance. A is left-middle and B right far-end.
  5. Layout from the entrance — left side: D, A, F; right side: C, E, B.
  6. E sits on the right side facing the corridor, i.e. facing across towards the left side; his left hand then points back towards the entrance, where C's office is.

Remember · In corridor puzzles, fix each person's side first, then use 'corner', 'faces' and 'further down'; finally turn the map to the person's own facing.

Question and answer: UPSC's official GS Paper II (2018, Series A) — paper ↗ · answer key ↗. Explanation: Minimalist IAS, checked 30 Sept 2026 (how we verify). Permalink ·

Directions for the following 2 (two) items: Read the following information and answer the two items that follow.

The plan of an office block for six officers A, B, C, D, E and F is as follows: Both B and C occupy offices to the right of the corridor (as one enters the office block) and A occupies on the left of the corridor. E and F occupy offices on opposite sides of the corridor but their offices do not face each other. The offices of C and D face each other. E does not have a corner office. F’s office is further down the corridor than A’s, but on the same side.

Who is/are F’s immediate neighbour/neighbours?

Answer & explanation

Answer: (a) A only

F has the corner office at the far end of the left side, with A's office beside it (D, A, F from the entrance). B's office faces F across the corridor but is not beside it, so A is F's only immediate neighbour.

  1. Sides: B and C are on the right, A on the left. D faces C, so D is on the left; F is on A's side, so F is on the left, and E is on the right.
  2. Each side has three offices. E has no corner office, so E is in the middle office on the right.
  3. F does not face E, so F is not in the middle; F is further down than A, so F has the far-end office on the left.
  4. D must face C; the middle office on the right is E's, so C and D take the offices nearest the entrance. A is left-middle and B right far-end.
  5. Layout from the entrance — left side: D, A, F; right side: C, E, B.
  6. F is at the end of the left side, so the only office beside F is A's; B, across the corridor, faces F rather than adjoins it.

Remember · Neighbours share a wall on the same side; an office across the corridor is 'facing', not 'next to'.

Question and answer: UPSC's official GS Paper II (2018, Series A) — paper ↗ · answer key ↗. Explanation: Minimalist IAS, checked 30 Sept 2026 (how we verify). Permalink ·

Directions for the following 7 (seven) items: Read the following four passages and answer the items that follow. Your answers to these items should be based on the passages only.

Passage—1

‘Desertification’ is a term used to explain a process of decline in the biological productivity of an ecosystem, leading to total loss of productivity. While this phenomenon is often linked to the arid, semi-arid and sub-humid ecosystems, even in the humid tropics, the impact could be most dramatic. Impoverishment of human-impacted terrestrial ecosystems may exhibit itself in a variety of ways: accelerated erosion as in the mountain regions of the country, salinization of land as in the semi-arid and arid ‘green revolution’ areas of the country, e.g., Haryana and western Uttar Pradesh, and site quality decline—a common phenomenon due to general decline in tree cover and monotonous monoculture of rice/wheat across the Indian plains. A major consequence of deforestation is that it relates to adverse alterations in the hydrology and related soil and nutrient losses. The consequences of deforestation invariably arise out of site degradation through erosive losses. Tropical Asia, Africa and South America have the highest levels of erosion. The already high rates for the tropics are increasing at an alarming rate (e.g., through the major river systems—Ganga and Brahmaputra, in the Indian context), due to deforestation and ill-suited land management practices subsequent to forest clearing. In the mountain context, the declining moisture retention of the mountain soils, drying up of the underground springs and smaller rivers in the Himalayan region could be attributed to drastic changes in the forest cover. An indirect consequence is drastic alteration in the upland-lowland interaction, mediated through water. The current concern the tea planter of Assam has is about the damage to tea plantations due to frequent inundation along the flood-plains of Brahmaputra, and the damage to tea plantation and the consequent loss in tea productivity is due to rising level of the river bottom because of siltation and the changing course of the river system. The ultimate consequences of site desertification are soil degradation, alteration in available water and its quality, and the consequent decline in food, fodder and fuel-wood yields essential for the economic well-being of rural communities.

According to the passage, which of the following are the consequences of decline in forest cover?

  1. 1.Loss of topsoil
  2. 2.Loss of smaller rivers
  3. 3.Adverse effect on agricultural production
  4. 4.Declining of groundwater

Select the correct answer using the code given below.

Answer & explanation

Answer: (d) 1, 2, 3 and 4

The passage traces a chain from forest loss to erosion, drying springs and rivers, altered water availability and finally falling food, fodder and fuel-wood yields. Each of the four statements is a link in that chain.

  • ✓ 1. Deforestation brings 'soil and nutrient losses' through 'erosive losses', and soil degradation is named among the ultimate consequences.
  • ✓ 2. 'drying up of the underground springs and smaller rivers in the Himalayan region' is attributed to drastic changes in forest cover.
  • ✓ 3. The ultimate consequences include 'decline in food, fodder and fuel-wood yields', and the Assam example shows lost tea productivity.
  • ✓ 4. Falling moisture retention of mountain soils, drying underground springs and 'alteration in available water' point to declining groundwater.

Remember · In 'consequences' questions, follow the passage's causal chain to its end; indirect and ultimate consequences count too.

Question and answer: UPSC's official GS Paper II (2018, Series A) — paper ↗ · answer key ↗. Explanation: Minimalist IAS, checked 30 Sept 2026 (how we verify). Permalink ·

Which of the following is/are the correct inference/inferences that can be made from the passage?

  1. 1.Deforestation can cause changes in the course of rivers.
  2. 2.Salinization of land takes place due to human activities only.
  3. 3.Intense monoculture practice in plains is a major reason for desertification in Tropical Asia, Africa and South America.

Select the correct answer using the code given below.

Answer & explanation

Answer: (a) 1 only

The Brahmaputra example links deforestation-driven erosion and siltation to 'the changing course of the river system', so statement 1 follows. Statement 2 adds 'only', and statement 3 carries the monoculture of the Indian plains over to other continents — neither is in the passage.

  • ✓ 1. Deforestation causes erosive losses and siltation, and the passage ties 'siltation and the changing course of the river system' together in the Brahmaputra example.
  • ✗ 2. Salinization in 'green revolution' areas is one example of impoverishment of human-impacted ecosystems; the passage never says human activity is its only cause.
  • ✗ 3. Rice/wheat monoculture is mentioned for 'the Indian plains'; the high erosion in Tropical Asia, Africa and South America is linked to deforestation and ill-suited land management.

Remember · Reject inferences that add absolute words ('only') or move an example from one place to a different region.

Question and answer: UPSC's official GS Paper II (2018, Series A) — paper ↗ · answer key ↗. Explanation: Minimalist IAS, checked 30 Sept 2026 (how we verify). Permalink ·

With reference to ‘desertification’, as described in the passage, the following assumptions have been made:

  1. 1.Desertification is a phenomenon in tropical areas only.
  2. 2.Deforestation invariably leads to floods and desertification.

Which of the above assumptions is/are valid?

Answer & explanation

Answer: (d) Neither 1 nor 2

Desertification is 'often linked to the arid, semi-arid and sub-humid ecosystems', and the humid tropics are added with 'even', so it is not a tropical phenomenon only. The passage's 'invariably' describes how deforestation's consequences arise, not a rule that every deforestation ends in floods and desertification.

  • ✗ 1. Arid, semi-arid and sub-humid ecosystems come first; the tropics are mentioned with 'even', as an addition, not the only setting.
  • ✗ 2. 'Invariably' in the passage refers to consequences arising 'out of site degradation through erosive losses'. Floods appear only in the Brahmaputra example, so the statement stretches the passage into a universal rule.

Remember · Check where the passage's 'invariably' or 'only' actually applies; an option that moves such a word to a new claim is usually wrong.

Question and answer: UPSC's official GS Paper II (2018, Series A) — paper ↗ · answer key ↗. Explanation: Minimalist IAS, checked 30 Sept 2026 (how we verify). Permalink ·

Passage—2

A diversity of natural assets will be needed to cope with climate change and ensure productive agriculture, forestry, and fisheries. For example, crop varieties are needed that perform well under drought, heat, and enhanced CO₂. But the private-sector and farmer-led process of choosing crops favours homogeneity adapted to past or current conditions, not varieties capable of producing consistently high yields in warmer, wetter, or drier conditions. Accelerated breeding programmes are needed to conserve a wider pool of genetic resources of existing crops, breeds, and their wild relatives. Relatively intact ecosystems, such as forested catchments, mangroves, wetlands, can buffer the impacts of climate change. Under a changing climate, these ecosystems are themselves at risk, and management approaches will need to be more proactive and adaptive. Connections between natural areas, such as migration corridors, may be needed to facilitate species movements to keep up with the change in climate.

With reference to the above passage, which of the following would assist us in coping with the climate change?

  1. 1.Conservation of natural water sources
  2. 2.Conservation of wider gene pool
  3. 3.Existing crop management practices
  4. 4.Migration corridors

Select the correct answer using the code given below.

Answer & explanation

Answer: (b) 1, 2 and 4 only

The passage names intact ecosystems such as forested catchments and wetlands, a wider pool of genetic resources, and migration corridors as aids to coping. Current crop choices, which favour homogeneity suited to past conditions, are part of the problem, not the solution.

  • ✓ 1. 'Relatively intact ecosystems, such as forested catchments, mangroves, wetlands, can buffer the impacts of climate change' — these are natural water sources.
  • ✓ 2. 'Accelerated breeding programmes are needed to conserve a wider pool of genetic resources'.
  • ✗ 3. The existing process 'favours homogeneity adapted to past or current conditions', not varieties for warmer, wetter or drier conditions; the passage wants it changed.
  • ✓ 4. Migration corridors 'may be needed to facilitate species movements to keep up with the change in climate'.

Remember · Separate what the passage recommends from what it criticises; 'existing' or 'current' practices are often the criticised part.

Question and answer: UPSC's official GS Paper II (2018, Series A) — paper ↗ · answer key ↗. Explanation: Minimalist IAS, checked 30 Sept 2026 (how we verify). Permalink ·

With reference to the above passage, the following assumptions have been made:

  1. 1.Diversification of livelihoods acts as a coping strategy for climate change.
  2. 2.Adoption of monocropping practice leads to the extinction of plant varieties and their wild relatives.

Which of the above assumptions is/are valid?

Answer & explanation

Answer: (c) Both 1 and 2

UPSC's official answer: (c) · the answer UPSC accepted, and the one that counts in the exam

Also defensible: (b)

  • Assumption 2 is clearly made. Crop choice 'favours homogeneity', and 'accelerated breeding programmes are needed to conserve a wider pool of genetic resources of existing crops, breeds, and their wild relatives'. One conserves what is being lost, so the author assumes that uniform cropping is losing varieties and their wild relatives.
  • Assumption 1 speaks of 'diversification of livelihoods'. The passage says 'a diversity of natural assets will be needed to cope with climate change and ensure productive agriculture, forestry, and fisheries': the diversity it wants is of natural assets (crop varieties, ecosystems, corridors), and livelihoods are never mentioned.
  • UPSC's key reads 'agriculture, forestry, and fisheries' as diversified livelihoods and accepts 1, giving (c); on the passage's own words only 2 is assumed, giving (b).

UPSC's key accepts both assumptions; a stricter reading of 'diversity of natural assets' accepts only 2, giving (b). In the exam, when a passage's central idea is 'diversity helps us cope', UPSC accepts a broadly worded restatement of it as a valid assumption, so pick 'both' unless a statement contradicts the passage.

This box is Minimalist IAS's analysis, with its sources; it does not change UPSC's answer.

UPSC's key accepts both assumptions. The passage opens by making diversity the way to cope with climate change and keep agriculture, forestry and fisheries productive, the livelihoods that rest on natural assets; and it urges conservation of a wider gene pool because crop choice is drifting towards homogeneity, which assumes that uniform cropping is losing varieties and their wild relatives.

  • ✓ 1. The opening sentence ties a 'diversity of natural assets' to coping with climate change and to productive 'agriculture, forestry, and fisheries'. Read for its underlying belief, the author assumes that spreading the basis of livelihoods across diverse assets and sectors is how people cope with a changing climate.
  • ✓ 2. Crop choice 'favours homogeneity', and breeding programmes are 'needed to conserve a wider pool of genetic resources of existing crops, breeds, and their wild relatives'. One conserves what is being lost: the author assumes that uniform (mono) cropping is driving varieties and their wild relatives towards extinction.

Remember · An assumption is the unstated belief behind a recommendation: urging conservation of a gene pool assumes current practice is depleting it, and calling diversity the answer to climate change assumes that diversification is a coping strategy.

Question and answer: UPSC's official GS Paper II (2018, Series A) — paper ↗ · answer key ↗. Explanation: Minimalist IAS, checked 1 Oct 2026 (how we verify). Permalink ·
Passage—3

Today, the top environmental challenge is a combination of people and their aspirations. If the aspirations are more like the frugal ones we had after the Second World War, a lot more is possible than if we view the planet as a giant shopping mall. We need to get beyond the fascination with glitter and understand that the planet works as a biological system.

Which of the following is the most crucial and logical inference that can be made from the above passage?

Answer & explanation

Answer: (c) Reducing our consumerism is very much in our own interest.

The passage makes aspirations the core environmental challenge: with frugal aspirations 'a lot more is possible' than if we treat the planet as a giant shopping mall. The inference is that curbing consumerism serves our own interest.

  • ✗ (a) The passage asks for frugal aspirations, not that the Earth can meet only food, clothing and shelter.
  • ✗ (b) The focus is on aspirations; population control is never offered, let alone as 'the only way'.
  • ✓ (c) Frugal aspirations make 'a lot more' possible, while the 'giant shopping mall' view and 'fascination with glitter' must be left behind — less consumerism works in our favour.
  • ✗ (d) Understanding the planet as a biological system is part of the message, but 'can only help' overstates it and misses the point about consumption.

Remember · In short passages, find the contrast the author draws (frugal versus shopping mall); the answer states it plainly, without 'only'.

Question and answer: UPSC's official GS Paper II (2018, Series A) — paper ↗ · answer key ↗. Explanation: Minimalist IAS, checked 30 Sept 2026 (how we verify). Permalink ·

Passage—4

Some people believe that leadership is a quality which you have at birth or not at all. This theory is false, for the art of leadership can be acquired and can indeed be taught. This discovery is made in time of war and the results achieved can surprise even the instructors. Faced with the alternatives of going left or right, every soldier soon grasps that a prompt decision either way is better than an endless discussion. A firm choice of direction has an even chance of being right while to do nothing will be almost certainly wrong.

The author of the passage holds the view that

Answer & explanation

Answer: (b) leadership can be acquired as well as taught

The author rejects the idea that leadership is inborn and states that 'the art of leadership can be acquired and can indeed be taught'. Option (b) is that view.

  • ✗ (a) The discovery 'is made in time of war', but war is where it is noticed, not the only way leadership can be taught.
  • ✓ (b) Stated almost word for word: leadership 'can be acquired and can indeed be taught'.
  • ✗ (c) The results 'can surprise even the instructors', but the passage says nothing about how many people acquire leadership; the option reads numbers into 'surprise'.
  • ✗ (d) Contradicts the passage, which is confident that leadership can be taught.

Remember · 'Holds the view' questions reward the stated thesis; avoid options that add 'only' or read numbers into vague words.

Question and answer: UPSC's official GS Paper II (2018, Series A) — paper ↗ · answer key ↗. Explanation: Minimalist IAS, checked 30 Sept 2026 (how we verify). Permalink ·

A number consists of three digits of which the middle one is zero and their sum is 4. If the number formed by interchanging the first and last digits is greater than the number itself by 198, then the difference between the first and last digits is

Answer & explanation

Answer: (b) 2

Swapping the first and last digits of a three-digit number changes it by 99 × (difference of those digits). 198 ÷ 99 = 2, so the digits differ by 2 — the number is 103, which becomes 301.

  1. Let the number be 100a + c (middle digit 0); interchanged, it is 100c + a.
  2. (100c + a) − (100a + c) = 99(c − a) = 198, so c − a = 2.
  3. With a + c = 4: a = 1 and c = 3, so the number is 103.
  4. Check: 301 − 103 = 198.

Remember · Interchanging the end digits of a three-digit number changes it by 99 × their difference; divide the change by 99.

Question and answer: UPSC's official GS Paper II (2018, Series A) — paper ↗ · answer key ↗. Explanation: Minimalist IAS, checked 30 Sept 2026 (how we verify). Permalink ·

A solid cube of 3 cm side, painted on all its faces, is cut up into small cubes of 1 cm side. How many of the small cubes will have exactly two painted faces?

Answer & explanation

Answer: (a) 12

Small cubes with exactly two painted faces sit along the edges of the big cube, excluding the corners. A cube has 12 edges, each with 3 − 2 = 1 such cube here, giving 12.

  1. The cube splits into 3 × 3 × 3 = 27 small cubes.
  2. Corner cubes have 3 painted faces; edge cubes other than corners have exactly 2.
  3. Each edge has 3 small cubes, 2 of them corners, leaving 1 per edge.
  4. 12 edges × 1 = 12 cubes with exactly two painted faces.
  5. Check: 8 (three faces) + 12 (two) + 6 (one) + 1 (none) = 27.

Remember · Painted n-cube: 8 corners with three faces, 12(n − 2) edge cubes with two, 6(n − 2)² with one.

Question and answer: UPSC's official GS Paper II (2018, Series A) — paper ↗ · answer key ↗. Explanation: Minimalist IAS, checked 30 Sept 2026 (how we verify). Permalink ·

While writing all the numbers from 700 to 1000, how many numbers occur in which the digit at hundred’s place is greater than the digit at ten’s place, and the digit at ten’s place is greater than the digit at unit’s place?

Answer & explanation

Answer: (c) 85

Fix the hundreds digit h (7, 8 or 9). Any two different digits smaller than h, written in decreasing order, give exactly one valid number, so the count is C(7, 2) + C(8, 2) + C(9, 2) = 21 + 28 + 36 = 85.

  1. Hundreds digit 7: tens and units are two different digits from 0–6, written in decreasing order: C(7, 2) = 21.
  2. Hundreds digit 8: two digits from 0–7: C(8, 2) = 28.
  3. Hundreds digit 9: two digits from 0–8: C(9, 2) = 36.
  4. 1000 does not qualify. Total = 21 + 28 + 36 = 85.
  5. Check for 7: tens digit 6 allows 6 numbers (760–765), tens 5 allows 5, and so on: 6 + 5 + 4 + 3 + 2 + 1 = 21.

Remember · For strictly decreasing digits, choosing the digits fixes their order: count with combinations, not arrangements.

Question and answer: UPSC's official GS Paper II (2018, Series A) — paper ↗ · answer key ↗. Explanation: Minimalist IAS, checked 30 Sept 2026 (how we verify). Permalink ·

If Pen < Pencil, Pencil < Book and Book > Cap, then which one of the following is always true?

Answer & explanation

Answer: (b) Pen < Book

Pen < Pencil < Book is an unbroken chain, so Pen < Book always. Cap is tied only through Book > Cap, which says nothing about how Cap compares with Pen or Pencil.

  1. Join the first two relations: Pen < Pencil < Book, so Pen < Book.
  2. Book > Cap points the other way; Cap could be above or below Pen and Pencil.
  3. So (a), (c) and (d) are not always true, while (b) is.

Remember · A comparison is certain only if an unbroken chain of signs points the same way between the two items.

Question and answer: UPSC's official GS Paper II (2018, Series A) — paper ↗ · answer key ↗. Explanation: Minimalist IAS, checked 30 Sept 2026 (how we verify). Permalink ·

A bookseller sold ‘a’ number of Geography textbooks at the rate of ₹x per book, ‘a + 2’ number of History textbooks at the rate of ₹(x + 2) per book and ‘a − 2’ number of Mathematics textbooks at the rate of ₹(x − 2) per book. What is his total sale in ₹?

Answer & explanation

Answer: (b) 3ax + 8

Total sale = ax + (a + 2)(x + 2) + (a − 2)(x − 2). The terms 2a + 2x and −2a − 2x cancel, leaving 3ax + 8.

  1. Geography: a × x = ax.
  2. History: (a + 2)(x + 2) = ax + 2a + 2x + 4.
  3. Mathematics: (a − 2)(x − 2) = ax − 2a − 2x + 4.
  4. Sum: 3ax + 8.
  5. Check with a = 3, x = 5: 15 + 5 × 7 + 1 × 3 = 53, and 3 × 3 × 5 + 8 = 53.

Remember · Check algebraic options by putting small numbers into both the question and each option.

Question and answer: UPSC's official GS Paper II (2018, Series A) — paper ↗ · answer key ↗. Explanation: Minimalist IAS, checked 30 Sept 2026 (how we verify). Permalink ·

A bag contains 15 red balls and 20 black balls. Each ball is numbered either 1 or 2 or 3. 20% of the red balls are numbered 1 and 40% of them are numbered 3. Similarly, among the black balls, 45% are numbered 2 and 30% are numbered 3. A boy picks a ball at random. He wins if the ball is red and numbered 3 or if it is black and numbered 1 or 2. What are the chances of his winning?

Answer & explanation

Answer: (b) 4/7

Winning balls are the red ones numbered 3 (40% of 15 = 6) and the black ones numbered 1 or 2 (70% of 20 = 14). That is 20 winning balls out of 35, a chance of 4/7.

  1. Red numbered 3: 40% of 15 = 6.
  2. Black numbered 3: 30% of 20 = 6, so black numbered 1 or 2 = 20 − 6 = 14.
  3. Winning balls = 6 + 14 = 20 out of 35.
  4. Probability = 20/35 = 4/7.

Remember · Count the favourable balls directly; use a complement (100% − 30%) when it is quicker than adding separate percentages.

Question and answer: UPSC's official GS Paper II (2018, Series A) — paper ↗ · answer key ↗. Explanation: Minimalist IAS, checked 30 Sept 2026 (how we verify). Permalink ·

Two persons, A and B are running on a circular track. At the start, B is ahead of A and their positions make an angle of 30° at the centre of the circle. When A reaches the point diametrically opposite to his starting point, he meets B. What is the ratio of speeds of A and B, if they are running with uniform speeds?

Answer & explanation

Answer: (a) 6: 5

A covers half the track, 180°. B started 30° ahead and is caught at that same point, so B covered 180° − 30° = 150° in the same time. The speeds are in the ratio 180 : 150 = 6 : 5.

  1. A runs from his start to the diametrically opposite point: an arc of 180°.
  2. B started 30° ahead in the direction of running and is met there: B runs 180° − 30° = 150°.
  3. Same time, so speed ratio = arc ratio = 180 : 150 = 6 : 5.

Remember · On a circular track, measure distances as angles; in equal time, the speed ratio equals the ratio of arcs covered.

Question and answer: UPSC's official GS Paper II (2018, Series A) — paper ↗ · answer key ↗. Explanation: Minimalist IAS, checked 30 Sept 2026 (how we verify). Permalink ·

A student has to get 40% marks to pass in an examination. Suppose he gets 30 marks and fails by 30 marks, then what are the maximum marks in the examination?

Answer & explanation

Answer: (c) 150

Scoring 30 and falling 30 short means the pass mark is 60. If 60 is 40% of the maximum, the maximum is 60 ÷ 0.4 = 150.

  1. Pass mark = marks scored + shortfall = 30 + 30 = 60.
  2. 40% of maximum = 60, so maximum = 60 × 100 ÷ 40 = 150.
  3. Check: 40% of 150 = 60, and 60 − 30 = 30.

Remember · Pass mark = marks scored + shortfall; divide it by the pass percentage to get the maximum marks.

Question and answer: UPSC's official GS Paper II (2018, Series A) — paper ↗ · answer key ↗. Explanation: Minimalist IAS, checked 30 Sept 2026 (how we verify). Permalink ·

19 boys turn out for playing hockey. Of these, 11 are wearing hockey shirts and 14 are wearing hockey pants. There are no boys without shirts and/or pants. What is the number of boys wearing full uniform?

Answer & explanation

Answer: (c) 6

Every boy wears at least a shirt or pants, so adding shirts and pants counts the boys in full uniform twice. 11 + 14 − 19 = 6 boys wear both.

  1. Every one of the 19 boys wears a shirt, pants or both.
  2. Shirts + pants = 11 + 14 = 25, which counts the boys wearing both twice.
  3. Both = 25 − 19 = 6.
  4. Check: 5 with shirts only + 8 with pants only + 6 with both = 19.

Remember · For two overlapping groups that together cover everyone: both = first group + second group − total.

Question and answer: UPSC's official GS Paper II (2018, Series A) — paper ↗ · answer key ↗. Explanation: Minimalist IAS, checked 30 Sept 2026 (how we verify). Permalink ·

Directions for the following 6 (six) items: Read the information given below and answer the six items that follow.

A, B, C and D are students. They are studying in four different cities, viz., P, Q, R and S (not necessarily in that order). They are studying in Science college, Arts college, Commerce college and Engineering college (not necessarily in that order), which are situated in four different States, viz., Gujarat, Rajasthan, Assam and Kerala (not necessarily in that order). Further, it is given that—

  1. i.D is studying in Assam
  2. ii.Arts college is located in city S which is in Rajasthan
  3. iii.A is studying in Commerce college
  4. iv.B is studying in city Q
  5. v.Science college is located in Kerala

A is studying in

Answer & explanation

Answer: (b) Gujarat

Science and Arts take Kerala and Rajasthan, leaving Gujarat and Assam for Commerce and Engineering. D is in Assam and cannot be in A's Commerce college, so Engineering is in Assam and A's Commerce college is in Gujarat.

  1. Science is in Kerala and Arts in Rajasthan (city S), so Commerce and Engineering are in Gujarat and Assam.
  2. D is in Assam, so D studies Commerce or Engineering; Commerce is A's, so D is in Engineering — in Assam — and A's Commerce college is in Gujarat.
  3. B and C share Science and Arts. B is in city Q, but Arts is in city S, so B is in Science (Kerala, city Q) and C in Arts (Rajasthan, city S).
  4. A and D are in cities P and R, in an order the data do not fix.
  5. Result: A — Commerce, Gujarat; B — Science, Kerala, city Q; C — Arts, Rajasthan, city S; D — Engineering, Assam.
  6. So A studies in Gujarat; Rajasthan is C's State, Kerala is B's, and city Q is B's city.

Remember · In grid puzzles, place the fixed pairs first (college with State), then use the 'who is where' clues to settle the two-way choices.

Question and answer: UPSC's official GS Paper II (2018, Series A) — paper ↗ · answer key ↗. Explanation: Minimalist IAS, checked 30 Sept 2026 (how we verify). Permalink ·

Directions for the following 6 (six) items: Read the information given below and answer the six items that follow.

A, B, C and D are students. They are studying in four different cities, viz., P, Q, R and S (not necessarily in that order). They are studying in Science college, Arts college, Commerce college and Engineering college (not necessarily in that order), which are situated in four different States, viz., Gujarat, Rajasthan, Assam and Kerala (not necessarily in that order). Further, it is given that—

  1. i.D is studying in Assam
  2. ii.Arts college is located in city S which is in Rajasthan
  3. iii.A is studying in Commerce college
  4. iv.B is studying in city Q
  5. v.Science college is located in Kerala

Science college is located in

Answer & explanation

Answer: (a) city Q

B is in city Q. B cannot be in the Arts college, which is in city S, and Commerce and Engineering belong to A and D, so B is in the Science college — which places Science in city Q.

  1. Science is in Kerala and Arts in Rajasthan (city S), so Commerce and Engineering are in Gujarat and Assam.
  2. D is in Assam, so D studies Commerce or Engineering; Commerce is A's, so D is in Engineering — in Assam — and A's Commerce college is in Gujarat.
  3. B and C share Science and Arts. B is in city Q, but Arts is in city S, so B is in Science (Kerala, city Q) and C in Arts (Rajasthan, city S).
  4. A and D are in cities P and R, in an order the data do not fix.
  5. Result: A — Commerce, Gujarat; B — Science, Kerala, city Q; C — Arts, Rajasthan, city S; D — Engineering, Assam.
  6. B studies Science and is in city Q, so the Science college is in city Q.

Remember · In grid puzzles, place the fixed pairs first (college with State), then use the 'who is where' clues to settle the two-way choices.

Question and answer: UPSC's official GS Paper II (2018, Series A) — paper ↗ · answer key ↗. Explanation: Minimalist IAS, checked 30 Sept 2026 (how we verify). Permalink ·

Directions for the following 6 (six) items: Read the information given below and answer the six items that follow.

A, B, C and D are students. They are studying in four different cities, viz., P, Q, R and S (not necessarily in that order). They are studying in Science college, Arts college, Commerce college and Engineering college (not necessarily in that order), which are situated in four different States, viz., Gujarat, Rajasthan, Assam and Kerala (not necessarily in that order). Further, it is given that—

  1. i.D is studying in Assam
  2. ii.Arts college is located in city S which is in Rajasthan
  3. iii.A is studying in Commerce college
  4. iv.B is studying in city Q
  5. v.Science college is located in Kerala

C is studying in

Answer & explanation

Answer: (b) Rajasthan

Once A (Commerce), D (Engineering) and B (Science, city Q) are placed, C is left with the Arts college, which is in city S in Rajasthan.

  1. Science is in Kerala and Arts in Rajasthan (city S), so Commerce and Engineering are in Gujarat and Assam.
  2. D is in Assam, so D studies Commerce or Engineering; Commerce is A's, so D is in Engineering — in Assam — and A's Commerce college is in Gujarat.
  3. B and C share Science and Arts. B is in city Q, but Arts is in city S, so B is in Science (Kerala, city Q) and C in Arts (Rajasthan, city S).
  4. A and D are in cities P and R, in an order the data do not fix.
  5. Result: A — Commerce, Gujarat; B — Science, Kerala, city Q; C — Arts, Rajasthan, city S; D — Engineering, Assam.
  6. C studies in the Arts college in city S, Rajasthan; Science and city Q are B's, and Gujarat is A's.

Remember · In grid puzzles, place the fixed pairs first (college with State), then use the 'who is where' clues to settle the two-way choices.

Question and answer: UPSC's official GS Paper II (2018, Series A) — paper ↗ · answer key ↗. Explanation: Minimalist IAS, checked 30 Sept 2026 (how we verify). Permalink ·

Directions for the following 6 (six) items: Read the information given below and answer the six items that follow.

A, B, C and D are students. They are studying in four different cities, viz., P, Q, R and S (not necessarily in that order). They are studying in Science college, Arts college, Commerce college and Engineering college (not necessarily in that order), which are situated in four different States, viz., Gujarat, Rajasthan, Assam and Kerala (not necessarily in that order). Further, it is given that—

  1. i.D is studying in Assam
  2. ii.Arts college is located in city S which is in Rajasthan
  3. iii.A is studying in Commerce college
  4. iv.B is studying in city Q
  5. v.Science college is located in Kerala

Which one of the following statements is correct?

Answer & explanation

Answer: (a) D is not studying in city S.

City S holds the Arts college, which is C's, so D — in the Engineering college in Assam — cannot be in city S. The other statements contradict the solved grid: A is in Commerce in Gujarat, and Engineering is in Assam.

  1. Science is in Kerala and Arts in Rajasthan (city S), so Commerce and Engineering are in Gujarat and Assam.
  2. D is in Assam, so D studies Commerce or Engineering; Commerce is A's, so D is in Engineering — in Assam — and A's Commerce college is in Gujarat.
  3. B and C share Science and Arts. B is in city Q, but Arts is in city S, so B is in Science (Kerala, city Q) and C in Arts (Rajasthan, city S).
  4. A and D are in cities P and R, in an order the data do not fix.
  5. Result: A — Commerce, Gujarat; B — Science, Kerala, city Q; C — Arts, Rajasthan, city S; D — Engineering, Assam.
  6. (a) is true because city S is C's; (b) and (c) fail since A is in Commerce in Gujarat; (d) fails since Engineering is in Assam.

Remember · In grid puzzles, place the fixed pairs first (college with State), then use the 'who is where' clues to settle the two-way choices.

Question and answer: UPSC's official GS Paper II (2018, Series A) — paper ↗ · answer key ↗. Explanation: Minimalist IAS, checked 30 Sept 2026 (how we verify). Permalink ·

Directions for the following 6 (six) items: Read the information given below and answer the six items that follow.

A, B, C and D are students. They are studying in four different cities, viz., P, Q, R and S (not necessarily in that order). They are studying in Science college, Arts college, Commerce college and Engineering college (not necessarily in that order), which are situated in four different States, viz., Gujarat, Rajasthan, Assam and Kerala (not necessarily in that order). Further, it is given that—

  1. i.D is studying in Assam
  2. ii.Arts college is located in city S which is in Rajasthan
  3. iii.A is studying in Commerce college
  4. iv.B is studying in city Q
  5. v.Science college is located in Kerala

Which one of the following statements is correct regarding Engineering college?

Answer & explanation

Answer: (d) D is studying there.

D is in Assam, and only Commerce or Engineering can be in Assam; since Commerce is A's, D studies in the Engineering college.

  1. Science is in Kerala and Arts in Rajasthan (city S), so Commerce and Engineering are in Gujarat and Assam.
  2. D is in Assam, so D studies Commerce or Engineering; Commerce is A's, so D is in Engineering — in Assam — and A's Commerce college is in Gujarat.
  3. B and C share Science and Arts. B is in city Q, but Arts is in city S, so B is in Science (Kerala, city Q) and C in Arts (Rajasthan, city S).
  4. A and D are in cities P and R, in an order the data do not fix.
  5. Result: A — Commerce, Gujarat; B — Science, Kerala, city Q; C — Arts, Rajasthan, city S; D — Engineering, Assam.
  6. Engineering is D's college, in Assam; B is in Science, C in Arts, and Gujarat has the Commerce college.

Remember · In grid puzzles, place the fixed pairs first (college with State), then use the 'who is where' clues to settle the two-way choices.

Question and answer: UPSC's official GS Paper II (2018, Series A) — paper ↗ · answer key ↗. Explanation: Minimalist IAS, checked 30 Sept 2026 (how we verify). Permalink ·

Directions for the following 6 (six) items: Read the information given below and answer the six items that follow.

A, B, C and D are students. They are studying in four different cities, viz., P, Q, R and S (not necessarily in that order). They are studying in Science college, Arts college, Commerce college and Engineering college (not necessarily in that order), which are situated in four different States, viz., Gujarat, Rajasthan, Assam and Kerala (not necessarily in that order). Further, it is given that—

  1. i.D is studying in Assam
  2. ii.Arts college is located in city S which is in Rajasthan
  3. iii.A is studying in Commerce college
  4. iv.B is studying in city Q
  5. v.Science college is located in Kerala

Which one of the following statements is correct?

Answer & explanation

Answer: (a) Engineering college is located in Assam.

D, who is in Assam, studies Engineering, so the Engineering college is in Assam. City Q is B's city in Kerala, C is in Rajasthan and B is in Kerala, so the other three statements are false.

  1. Science is in Kerala and Arts in Rajasthan (city S), so Commerce and Engineering are in Gujarat and Assam.
  2. D is in Assam, so D studies Commerce or Engineering; Commerce is A's, so D is in Engineering — in Assam — and A's Commerce college is in Gujarat.
  3. B and C share Science and Arts. B is in city Q, but Arts is in city S, so B is in Science (Kerala, city Q) and C in Arts (Rajasthan, city S).
  4. A and D are in cities P and R, in an order the data do not fix.
  5. Result: A — Commerce, Gujarat; B — Science, Kerala, city Q; C — Arts, Rajasthan, city S; D — Engineering, Assam.
  6. (a) holds; city Q is in Kerala (not Assam), C is in Rajasthan and B is in Kerala.

Remember · In grid puzzles, place the fixed pairs first (college with State), then use the 'who is where' clues to settle the two-way choices.

Question and answer: UPSC's official GS Paper II (2018, Series A) — paper ↗ · answer key ↗. Explanation: Minimalist IAS, checked 30 Sept 2026 (how we verify). Permalink ·

Directions for the following 8 (eight) items: Read the following eight passages and answer the items that follow. Your answers to these items should be based on the passages only.

Passage—1

All actions to address climate change ultimately involve costs. Funding is vital in order for countries like India to design and implement adaptation and mitigation plans and projects. The problem is more severe for developing countries like India, which would be one of the hardest hit by climate change, given its need to finance development. Most countries do indeed treat climate change as real threat and are striving to address it in a more comprehensive and integrated manner with the limited resources at their disposal.

With reference to the above passage, the following assumptions have been made:

  1. 1.Climate change is not a challenge for developed countries.
  2. 2.Climate change is a complex policy issue and also a development issue for many countries.
  3. 3.Ways and means of finance must be found to enable developing countries to enhance their adaptive capacity.

Which of the above assumptions is/are valid?

Answer & explanation

Answer: (c) 2 and 3 only

Climate action is costly, and developing countries like India must fund it alongside their development needs. The passage therefore assumes climate change is bound up with development (2) and that finance must be found for adaptation (3); nothing suggests developed countries face no challenge.

  • ✗ 1. The problem is 'more severe' for developing countries — a comparison implying it exists for others too — and 'Most countries' treat it as a real threat.
  • ✓ 2. India's difficulty is tied to 'its need to finance development', and countries tackle it 'in a more comprehensive and integrated manner' — a policy and development issue.
  • ✓ 3. 'Funding is vital' for adaptation and mitigation plans, and resources are 'limited'; the argument assumes finance must be found for developing countries.

Remember · 'More severe for X' implies the problem exists for others as well; an assumption denying it for others is invalid.

Question and answer: UPSC's official GS Paper II (2018, Series A) — paper ↗ · answer key ↗. Explanation: Minimalist IAS, checked 30 Sept 2026 (how we verify). Permalink ·

Passage—2

Cooking with biomass and coal in India is now recognized to cause major health problems, with women and children in poor populations facing the greatest risk. There are more than 10 lakh premature deaths each year from household air pollution due to polluting cooking fuels with another 1.5 lakh due to their contribution to general outdoor air pollution in the country. Although the fraction of the Indian population using clean cooking fuels, such as LPG, natural gas and electricity, is slowly rising, the number using polluting solid fuels as their primary cooking fuel has remained static for nearly 30 years at about 70 crore.

Which of the following is the most crucial and logical inference that can be made from the above passage?

Answer & explanation

Answer: (d) Access to cooking gas can reduce premature deaths in poor households.

Polluting cooking fuels cause more than 10 lakh premature deaths a year from household air pollution, with the poor at greatest risk. If households get clean fuels such as LPG, these deaths can come down — option (d).

  • ✗ (a) The number using solid fuels 'has remained static for nearly 30 years at about 70 crore', and rural awareness is never mentioned.
  • ✗ (b) Subsidies are not discussed, and 'will solve the problem' is far stronger than the passage allows.
  • ✗ (c) Gas imports and power generation are policy choices the passage does not consider.
  • ✓ (d) The deaths come from 'household air pollution due to polluting cooking fuels', and poor women and children face the greatest risk; clean cooking gas removes that cause, so access to it can reduce deaths.

Remember · Prefer the modest inference that links the passage's cause and effect ('can reduce') over sweeping solutions ('will solve').

Question and answer: UPSC's official GS Paper II (2018, Series A) — paper ↗ · answer key ↗. Explanation: Minimalist IAS, checked 30 Sept 2026 (how we verify). Permalink ·

Passage—3

Scientific knowledge has its dangers, but so has every great thing. Over and beyond the dangers with which it threatens the present, it opens up as nothing else can, the vision of a possible happy world; a world without poverty, without war, with little illness. Science, whatever unpleasant consequences it may have by the way, is in its very nature a liberator.

Which one of the following is the most important implication of the passage?

Answer & explanation

Answer: (a) A happy world is a dream of science.

Why not the tempting option · UPSC's key is (a). The tempting (c) leans on 'as nothing else can', but that phrase describes how science opens up the vision; the passage never says a happy world is impossible without science, so (c) states a stricter condition than the text supports. In the exam, keep to the passage's own strength of claim: a 'vision of a possible' world is a dream, not a necessary condition.

Despite its dangers, science 'opens up as nothing else can, the vision of a possible happy world', without poverty, war or much illness, and is 'in its very nature a liberator'. The passage's claim is about a vision, a possibility: a happy world is what science holds out, its dream, so (a).

  • ✓ (a) The passage speaks of the 'vision of a possible happy world' that science opens up; a happy world is the dream science holds out.
  • ✗ (b) Science is never called the only major threat; the passage says every great thing has its dangers.
  • ✗ (c) 'As nothing else can' describes how science opens up the vision; it does not say a happy world is impossible without science. (c) turns a vision into a strict necessary condition the passage never states.
  • ✗ (d) Contradicts the passage, which speaks of a 'possible' happy world.

Remember · When a passage speaks of a 'vision' or 'possibility', prefer the option that keeps that tone over one that states a strict condition.

Question and answer: UPSC's official GS Paper II (2018, Series A) — paper ↗ · answer key ↗. Explanation: Minimalist IAS, checked 1 Oct 2026 (how we verify). Permalink ·
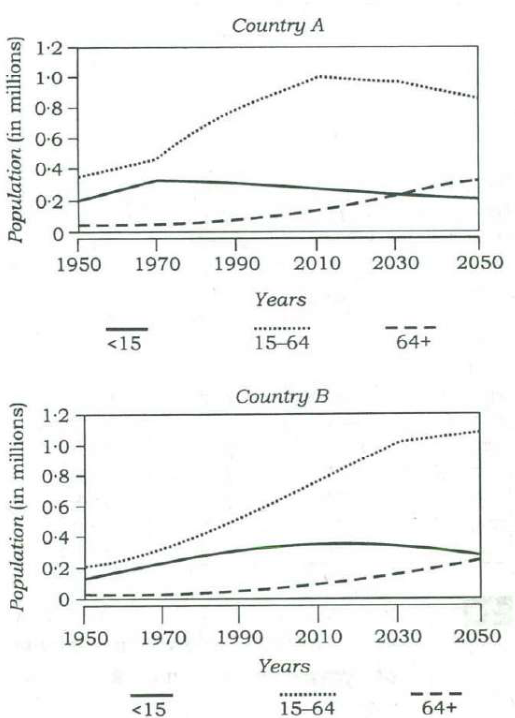
Passage—4

The Arctic’s vast reserves of fossil fuel, fish and minerals are now accessible for a longer period in a year. But unlike Antarctica, which is protected from exploitation by the Antarctic Treaty framed during the Cold War and is not subject to territorial claims by any country, there is no legal regime protecting the Arctic from industrialization, especially at a time when the world craves for more and more resources. The distinct possibility of ice-free summer has prompted countries with Arctic coastline to scramble for great chunks of the melting ocean.

Which one of the following is the most important implication of the passage?

Answer & explanation

Answer: (b) Melting of summer ice in the Arctic leads to changes in the geopolitics.

Melting has made Arctic resources reachable for longer, and with no legal regime like the Antarctic Treaty, countries with Arctic coastline are scrambling for chunks of the ocean. Melting ice is reshaping geopolitics — option (b).

  • ✗ (a) India is not mentioned; the scramble is among countries with an Arctic coastline.
  • ✓ (b) The 'distinct possibility of ice-free summer has prompted countries with Arctic coastline to scramble for great chunks of the melting ocean' — a geopolitical change driven by melting.
  • ✗ (c) The passage notes the world's craving for resources but never says the Arctic will end the shortage.
  • ✗ (d) The two poles are compared on legal protection, not on the size of their resources.

Remember · An implication links the passage's cause (melting ice, no treaty) to its effect (a scramble for territory); ignore actors or comparisons not in the text.

Question and answer: UPSC's official GS Paper II (2018, Series A) — paper ↗ · answer key ↗. Explanation: Minimalist IAS, checked 30 Sept 2026 (how we verify). Permalink ·

Passage—5

Being a member of the WTO, India is bound by the agreements that have been signed and ratified by its members, including itself. According to Article 6 of the Agriculture Agreement, providing minimum support prices for agricultural products is considered distorting and is subject to limits. The subsidy arising from ‘minimal supports’ cannot exceed 10 per cent of the value of agricultural production for developing countries. PDS in India entails minimum support prices and public stockholding of food grains. It is possible that, in some years, the subsidy to producers will exceed 10 per cent of the value of agricultural production.

What is the crucial message conveyed by the above passage?

Answer & explanation

Answer: (c) For India, food security collides with trade.

India's PDS rests on minimum support prices and public stockholding, but WTO rules cap such support at 10 per cent of the value of agricultural production — a cap India may exceed in some years. The crucial message is the clash between food security and trade commitments.

  • ✗ (a) A prescription the passage does not make; it points out the conflict without saying which side should give way.
  • ✗ (b) Too extreme; the passage takes membership as given and says India is bound by the agreements.
  • ✓ (c) PDS (food security) needs minimum support prices that WTO's Agriculture Agreement (trade) limits to 10 per cent — the two collide.
  • ✗ (d) Background at most; the passage is about the conflict with WTO rules, not a statement of India's achievement.

Remember · When a passage sets two commitments against each other, the crucial message is the conflict itself, not a remedy.

Question and answer: UPSC's official GS Paper II (2018, Series A) — paper ↗ · answer key ↗. Explanation: Minimalist IAS, checked 30 Sept 2026 (how we verify). Permalink ·

Passage—6

India’s educational system is modelled on the mass education system that developed in the 19th century in Europe and later spread around the world. The goal of the system is to condition children as ‘good’ citizens and productive workers. This suited the industrial age that needed the constant supply of a compliant workforce with a narrow set of capabilities. Our educational institutes resemble factories with bells, uniforms and batch-processing of learners, designed to get learners to conform. But, from an economic point of view, the environment today is very different. It is a complex, volatile and globally interconnected world.

With reference to the above passage, the following assumptions have been made:

  1. 1.India continues to be a developing country essentially due to its faulty education system.
  2. 2.Today’s learners need to acquire new-age skill-sets.
  3. 3.A good number of Indians go to some developed countries for education because the educational systems there are a perfect reflection of the societies in which they function.

Which of the above assumptions is/are valid?

Answer & explanation

Answer: (b) 2 only

India's schools were built to supply a compliant, narrowly skilled workforce for the industrial age, while today's world is complex, volatile and interconnected. The author must assume learners now need new skills; nothing links education to India's development status or to Indians studying abroad.

  • ✗ 1. The passage never connects the education system to India remaining a developing country; 'essentially due to' is an unsupported causal claim.
  • ✓ 2. Contrasting the industrial age's 'narrow set of capabilities' with today's 'complex, volatile and globally interconnected world' assumes learners need new skills.
  • ✗ 3. Indians studying abroad and systems that 'perfectly reflect' their societies lie outside the passage.

Remember · An assumption bridges the author's premise and point; new causes or facts the passage never touches are not assumptions.

Question and answer: UPSC's official GS Paper II (2018, Series A) — paper ↗ · answer key ↗. Explanation: Minimalist IAS, checked 30 Sept 2026 (how we verify). Permalink ·

Passage—7

The practice of dieting has become an epidemic; everyone is looking out for a way to attain that perfect body. We are all different with respect to our ethnicity, genetics, family history, gender, age, physical and mental and spiritual health status, lifestyles and preferences. Thereby we also differ in what foods we tolerate or are sensitive to. So we really cannot reduce so many complexities into one diet or diet book. This explains the failure of diets across the world in curbing obesity. Unless the reasons for weight gain are well understood and addressed and unless habits are changed permanently, no diet is likely to succeed.

What is the most logical and rational inference that can be made from the above passage?

Answer & explanation

Answer: (d) There is no perfect diet or one solution for obesity.

People differ in genetics, age, health, lifestyle and the foods they tolerate, so the passage says so many complexities cannot be reduced to one diet — which is why diets fail to curb obesity. The inference: no perfect diet, no single solution.

  • ✗ (a) The passage calls dieting an epidemic, not obesity; the option swaps the subject.
  • ✗ (b) That everyone seeks a perfect body is the passage's opening observation, not the inference its argument leads to.
  • ✗ (c) Diets fail unless causes are addressed and habits change — which implies obesity can be tackled, not that it is incurable.
  • ✓ (d) 'we really cannot reduce so many complexities into one diet or diet book' — no single diet suits everyone.

Remember · The inference is where the argument lands, not a restated opening line; also watch for options that swap the passage's subject.

Question and answer: UPSC's official GS Paper II (2018, Series A) — paper ↗ · answer key ↗. Explanation: Minimalist IAS, checked 30 Sept 2026 (how we verify). Permalink ·

Passage—8

Monoculture carries great risks. A single disease or pest can wipe out swathes of the world’s food production, an alarming prospect given that its growing and wealthier population will eat 70% more by 2050. The risks are magnified by the changing climate. As the planet warms and monsoon rains intensify, farmlands in Asia will flood. North America will suffer more intense droughts, and crop diseases will spread to new latitudes.

Which of the following is the most logical, rational and crucial message given by the passage?

Answer & explanation

Answer: (a) Preserving crop genetic diversity is an insurance against the effects of climate change.

Monoculture is risky because a single disease or pest can wipe out large parts of food production, and climate change magnifies that risk. Keeping crop genetic diversity spreads the risk — an insurance against climate effects.

  • ✓ (a) The opposite of monoculture is diversity; since 'A single disease or pest can wipe out swathes' of production and climate change magnifies the risk, preserving genetic diversity is the logical safeguard.
  • ✗ (b) Contradicts the opening warning that 'Monoculture carries great risks'.
  • ✗ (c) Genetically modified crops are not mentioned, and 'only' is extreme.
  • ✗ (d) Asia and North America are examples of climate effects; the passage does not rank them as the worst sufferers.

Remember · When a passage warns against a practice, its crucial message is often the opposite as a safeguard — here, diversity against monoculture.

Question and answer: UPSC's official GS Paper II (2018, Series A) — paper ↗ · answer key ↗. Explanation: Minimalist IAS, checked 30 Sept 2026 (how we verify). Permalink ·

A shopkeeper sells an article at ₹40 and gets X% profit. However, when he sells it at ₹20, he faces same percentage of loss. What is the original cost of the article?

Answer & explanation

Answer: (c) ₹30

An equal percentage profit and loss on the same cost means the two selling prices lie equally far above and below the cost. The cost is the average of ₹40 and ₹20, i.e. ₹30 (profit and loss both 33⅓%).

  1. Let the cost be C. Then 40 = C(1 + X/100) and 20 = C(1 − X/100).
  2. Adding the two: 60 = 2C, so C = ₹30.
  3. Check: ₹40 is 33⅓% above ₹30, and ₹20 is 33⅓% below it.

Remember · Same percentage profit and loss on one cost price: the cost is the average of the two selling prices.

Question and answer: UPSC's official GS Paper II (2018, Series A) — paper ↗ · answer key ↗. Explanation: Minimalist IAS, checked 30 Sept 2026 (how we verify). Permalink ·

There are 24 equally spaced points lying on the circumference of a circle. What is the maximum number of equilateral triangles that can be drawn by taking sets of three points as the vertices?

Answer & explanation

Answer: (c) 8

An equilateral triangle inscribed in a circle has its vertices 120° apart — every 8th point of 24. Each point belongs to exactly one such triangle, so there are 24 ÷ 3 = 8.

  1. Adjacent points are 360° ÷ 24 = 15° apart.
  2. An inscribed equilateral triangle needs vertices 120° apart: 120 ÷ 15 = 8 steps.
  3. Starting at points 1 to 8 gives different triangles (1-9-17, 2-10-18, …, 8-16-24); starting at 9 repeats the first.
  4. Number of triangles = 24 ÷ 3 = 8.

Remember · On n equally spaced points, inscribed regular k-gons exist only if k divides n, and there are n/k of them.

Question and answer: UPSC's official GS Paper II (2018, Series A) — paper ↗ · answer key ↗. Explanation: Minimalist IAS, checked 30 Sept 2026 (how we verify). Permalink ·

Consider the sequence given below:

4/12/95, 1/1/96, 29/1/96, 26/2/96, ....

What is the next term of the series?

Answer & explanation

Answer: (b) 25/3/96

Each date is 28 days after the one before. 26 February 1996 plus 28 days is 25 March, because 1996 is a leap year and February has 29 days.

  1. 4 December 1995 to 1 January 1996: 27 days to the end of December + 1 = 28 days.
  2. 1 January to 29 January: 28 days; 29 January to 26 February: 2 + 26 = 28 days.
  3. 1996 is divisible by 4, so February 1996 has 29 days.
  4. 26 February + 28 days: 3 days to 29 February, then 25 more — 25 March 1996.

Remember · In date sequences, find the constant gap in days and watch for leap years when crossing February.

Question and answer: UPSC's official GS Paper II (2018, Series A) — paper ↗ · answer key ↗. Explanation: Minimalist IAS, checked 30 Sept 2026 (how we verify). Permalink ·

Twelve equal squares are placed to fit in a rectangle of diagonal 5 cm. There are three rows containing four squares each. No gaps are left between adjacent squares. What is the area of each square?

Answer & explanation

Answer: (c) 1 sq cm

With squares of side s, the rectangle measures 4s by 3s, so its diagonal is 5s by Pythagoras. 5s = 5 cm gives s = 1 cm and an area of 1 sq cm.

  1. Let each square have side s; the rectangle is 4s long and 3s wide.
  2. Diagonal = √((4s)² + (3s)²) = 5s.
  3. 5s = 5, so s = 1 cm and each square's area is 1 sq cm.
  4. Check: a 4 cm × 3 cm rectangle has diagonal √25 = 5 cm.

Remember · Spot the 3-4-5 triangle: sides in the ratio 3 : 4 make the diagonal 5 parts.

Question and answer: UPSC's official GS Paper II (2018, Series A) — paper ↗ · answer key ↗. Explanation: Minimalist IAS, checked 30 Sept 2026 (how we verify). Permalink ·

Consider the following graph:

Line graph of % of work (0–100%) from 1st April to 1st September. The dashed ‘Expected progress’ line reaches about 25% by May, 50% by June, about 70% by August and 100% on 1st September; the solid ‘Actual progress’ line rises slowly to about 42% by August, then climbs steeply, crosses above the expected line and reaches 100% before 1st September.
From UPSC's question paper.

Which one of the following statements is not correct with reference to the graph given above?

Answer & explanation

Answer: (d) During the period from 1st April to 1st September, at no time was the actual progress more than the expected progress.

In August the actual-progress line shoots up, crosses above the expected line and reaches 100% before 1st September. So for a while actual progress did exceed expected progress, which makes statement (d) the incorrect one.

  1. (a) On 1st June actual progress is about 22% against an expected 50% — true.
  2. (b) The actual line is steepest in August, rising from about 42% to 100% — true.
  3. (c) Actual progress reaches 100% during August, before the expected finish on 1st September — true.
  4. (d) In late August the actual line crosses above the expected line, so actual progress was more than expected for a time — false.
  5. The statement that is not correct is (d).

Remember · In 'not correct' graph items, test every option against the picture, and look closely where two lines cross.

Question and answer: UPSC's official GS Paper II (2018, Series A) — paper ↗ · answer key ↗. Explanation: Minimalist IAS, checked 1 Oct 2026 (how we verify). Permalink ·
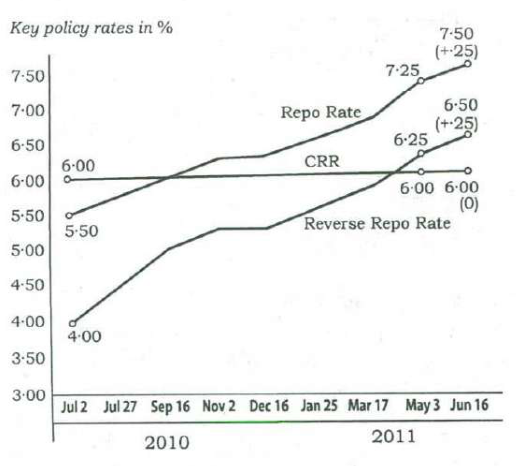
For a sports meet, a winners’ stand comprising three wooden blocks is in the following form:

A winners' stand of three rectangular blocks side by side: the tallest on the left, a middle-height block next to it and the shortest on the right.
From UPSC's question paper.

There are six different colours available to choose from and each of the three wooden blocks is to be painted such that no two of them has the same colour. In how many different ways can the winners’ stand be painted?

Answer & explanation

Answer: (a) 120

The three blocks are different (first, second and third place), so the order of colours matters. With six colours and no repeats there are 6 × 5 × 4 = 120 ways.

  1. The blocks differ in height, so each assignment of colours to blocks is a different painting.
  2. Tallest block: 6 choices; next block: 5; last block: 4.
  3. Ways = 6 × 5 × 4 = 120 (that is, ⁶P₃).

Remember · When the positions are distinct, use permutations: n × (n − 1) × … for as many positions as are filled.

Question and answer: UPSC's official GS Paper II (2018, Series A) — paper ↗ · answer key ↗. Explanation: Minimalist IAS, checked 1 Oct 2026 (how we verify). Permalink ·
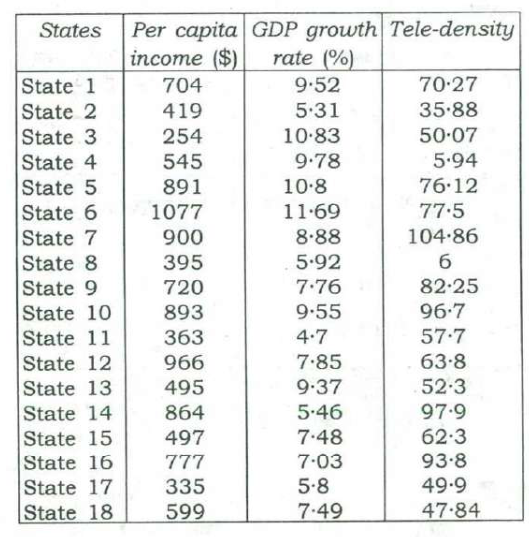
Directions for the following 2 (two) items: Consider the following graph in which the birthrate and death rate of a country are given, and answer the two items that follow.

Line graph, 1970–2010, of birth and death rates per thousand: the birthrate (solid) falls from 30 to about 22.5 in 1990 and 19 in 2000, then levels off at about 18; the death rate (dashed) falls from 25 to about 14 in 1990 and about 6.5 by 2000, then stays near 6.5–7.
From UPSC's question paper.

Looking at the graph, it can be inferred that from 1990 to 2010

Answer & explanation

Answer: (d) population growth rate shows no trend

Why not the tempting option · UPSC's key is (d). The gap between the two curves, which is the growth rate, widens from about 8.5 per thousand in 1990 to about 11.5 in 2000, then flattens and eases slightly to about 11 by 2010, so there is no single direction across 1990–2010. 'Has increased' is tempting because 2010 sits higher than 1990, but the rise ends at 2000 and the gap drifts down after that. In the exam, read a trend over a stated period as one consistent direction across the whole period, as UPSC does; its key to the next item likewise treats the growth rate as having stabilised after 2005.

The population growth rate is the gap between the birthrate and the death rate. From 1990 the gap widens, from about 8.5 to about 11.5 per thousand by 2000, and then flattens and eases slightly to about 11 by 2010. A rise followed by a plateau is not a single direction, so over 1990–2010 the growth rate shows no trend: (d).

  1. Natural growth rate = birthrate − death rate: the vertical gap between the two curves.
  2. 1990: about 22.5 − 14 = 8.5 per thousand. 1995: about 20 − 9.5 = 10.5.
  3. 2000: about 18.5 − 7 = 11.5. 2005: about 18 − 6.5 = 11.5. 2010: about 18 − 7 = 11.
  4. So the gap rises through the 1990s, then stops rising and dips a little through the 2000s.
  5. 'Increased' needs the rise to run through the whole period, but it ends at 2000; 'decreased' and 'stable' fail for the 1990s. A rise that then levels off is no single trend: (d).

Remember · Population growth rate = birth rate − death rate: read the gap between the curves, not the curves themselves. A rise that then levels off is 'no trend' over the whole period, not 'increased'.

Question and answer: UPSC's official GS Paper II (2018, Series A) — paper ↗ · answer key ↗. Explanation: Minimalist IAS, checked 1 Oct 2026 (how we verify). Permalink ·
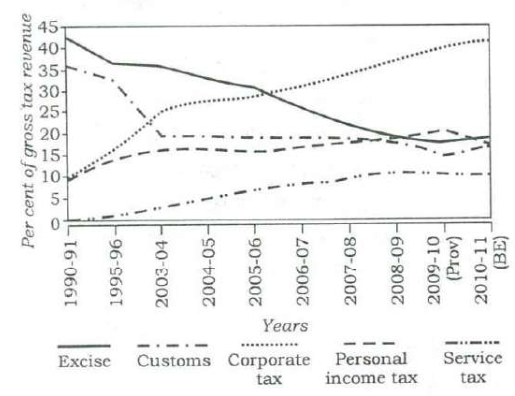
Directions for the following 2 (two) items: Consider the following graph in which the birthrate and death rate of a country are given, and answer the two items that follow.

With reference to the above graph, consider the following statements considering 1970 as base year:

  1. 1.Population has stabilized after 35 years.
  2. 2.Population growth rate has stabilized after 35 years.
  3. 3.Death rate has fallen by 10% in the first 10 years.
  4. 4.Birthrate has stabilized after 35 years.

Uses the same figure as Q63 ↑

Which of the above are the most logical and rational statements that can be made from the above graph?

Answer & explanation

Answer: (d) 2 and 4

From 2005 (35 years after 1970) both curves flatten — the birthrate near 18 and the death rate near 6.5–7 — so the birthrate and the growth rate (their gap) have stabilised. The population itself keeps growing, and the death rate fell by much more than 10% in 1970–80.

  1. 35 years after 1970 is 2005; compare the curves from 2005 to 2010.
  2. Birthrate: about 18 throughout; death rate: about 6.5 to 7; gap about 11 throughout.
  3. 1970–80: death rate from 25 to about 21, a fall of about 16%.
  • ✗ 1. Births stay well above deaths after 2005, so the population keeps growing; only its growth rate is steady.
  • ✓ 2. After 2005 the gap between the curves stays at about 11 per thousand, so the growth rate has stabilised.
  • ✗ 3. The death rate falls from 25 to about 21 per thousand in 1970–80, about 16% (4 points), not 10%.
  • ✓ 4. The birthrate curve runs flat at about 18 per thousand from 2005 to 2010.

Remember · A steady growth rate is not a steady population; population stops growing only when births equal deaths.

Question and answer: UPSC's official GS Paper II (2018, Series A) — paper ↗ · answer key ↗. Explanation: Minimalist IAS, checked 1 Oct 2026 (how we verify). Permalink ·

Average hourly earnings per year (E) of the workers in a firm are represented in figures A and B as follows:

Year20132014201520162017
E in Fig. A2025303540
E in Fig. B2025303540
Two line graphs of hourly earnings E for 2013–2017. Fig. A's vertical axis starts at 20 and is marked every 5; Fig. B's starts near 0 and is marked every 10. Both plot E = 20, 25, 30, 35 and 40, so the lines look different only because the scales differ.
From UPSC's question paper.

From the figures, it is observed that the

Answer & explanation

Answer: (c) slopes of the graphs are same

Both figures plot the same data: E rises from 20 to 40 by 5 each year. Only the axis scales differ, making one line look steeper; the actual slope — 5 per year — is the same in both.

  1. Fig. A: E = 20, 25, 30, 35, 40 for 2013–17; Fig. B shows the same points on a differently scaled axis.
  2. (a) The values are identical — false.
  3. (b) The range is 40 − 20 = 20 in both — false.
  4. (d) E rises by 5 a year in both — false.
  5. (c) Slope = change in E per year = 5 in both — true; the visual difference comes only from the scale.

Remember · Before comparing graphs, read the axis scales; stretching an axis changes how steep a line looks, not the data.

Question and answer: UPSC's official GS Paper II (2018, Series A) — paper ↗ · answer key ↗. Explanation: Minimalist IAS, checked 1 Oct 2026 (how we verify). Permalink ·

Consider the figures given below:

A 3 × 3 grid of line figures; the last cell is ‘?’. Each figure joins one of three bodies (a U-shaped curve with a dot, a straight bar with a solid square, an arc ending in a triangle) to one of three leg sets (two bent legs, three short T-shaped legs, four long forked legs). The four options are also drawn as figures.
From UPSC's question paper.

To fit the question mark, the correct answer is

Answer & explanation

Answer: (a) Figure: a straight bar with a solid square at its left end and two bent legs

Each row and each column uses each body once and each set of legs once. The last row already has the arc-with-triangle and U-with-dot bodies, and the T-shaped and forked legs, so the missing figure is the bar with a square and two bent legs — (a).

  1. Bodies: U-curve with dot, straight bar with square, arc with triangle. Legs: two bent, three T-shaped, four forked.
  2. Row 1: U + two bent; bar + three T; arc + four forked. Row 2: bar + four forked; arc + two bent; U + three T.
  3. Row 3 has arc + three T and U + four forked, so it lacks the bar body and the two bent legs.
  4. Column 3 agrees: arc and U are used, so the bar is missing; forked and T-shaped legs are used, so two bent legs are missing.
  5. Only (a) — a bar with a square and two bent legs — fits.

Remember · In 3 × 3 figure matrices, split each figure into parts and check that each part appears once in every row and column.

Question and answer: UPSC's official GS Paper II (2018, Series A) — paper ↗ · answer key ↗. Explanation: Minimalist IAS, checked 1 Oct 2026 (how we verify). Permalink ·

Consider the following figures A and B:

No. of piecesCost of production (₹ in lakhs), Fig. ASelling price per piece (₹), Fig. B
10006400
20007350
30008300
Fig. A: cost of production (₹ lakh) rises in a straight line from 5 at zero to 6, 7 and 8 at 1000, 2000 and 3000 pieces. Fig. B: selling price per piece falls along a curve from above ₹500 to ₹400 at 1000 pieces sold, then in a straight line to ₹350 at 2000 and ₹300 at 3000.
From UPSC's question paper.

The manufacturing cost and projected sales for a product are shown in the above figures A and B respectively. What is the minimum number of pieces that should be manufactured to avoid a loss?

Answer & explanation

Answer: (a) 2000

Revenue is pieces × price. At 1000 pieces it is ₹4 lakh against a cost of ₹6 lakh; at 2000 pieces it is 2000 × ₹350 = ₹7 lakh, exactly the cost. So 2000 pieces is the minimum that avoids a loss.

  1. 1000 pieces: revenue 1000 × 400 = ₹4 lakh; cost ₹6 lakh — a loss of ₹2 lakh.
  2. 1500 pieces: price about ₹375, revenue about ₹5.6 lakh; cost ₹6.5 lakh — still a loss.
  3. 2000 pieces: revenue 2000 × 350 = ₹7 lakh; cost ₹7 lakh — no loss (break-even).
  4. 3000 pieces: revenue 3000 × 300 = ₹9 lakh against ₹8 lakh — a profit, but 2000 already suffices.
  5. Minimum number to avoid a loss: 2000.

Remember · Break-even: compare revenue (quantity × price) with cost at each point; the first point where revenue reaches cost is the answer.

Question and answer: UPSC's official GS Paper II (2018, Series A) — paper ↗ · answer key ↗. Explanation: Minimalist IAS, checked 1 Oct 2026 (how we verify). Permalink ·

A lift has the capacity of 18 adults or 30 children. How many children can board the lift with 12 adults?

Answer & explanation

Answer: (b) 10

18 adults take the same space as 30 children, so one adult equals 5/3 of a child. 12 adults use the space of 20 children, leaving room for 10.

  1. 18 adults = 30 children, so 1 adult = 30/18 = 5/3 children.
  2. 12 adults = 12 × 5/3 = 20 children's worth of space.
  3. Room left = 30 − 20 = 10 children.
  4. Check: 12 adults fill 12/18 = 2/3 of the lift; the remaining 1/3 of 30 children is 10.

Remember · Convert everything to one unit (here child-spaces), subtract what is used, and read off what remains.

Question and answer: UPSC's official GS Paper II (2018, Series A) — paper ↗ · answer key ↗. Explanation: Minimalist IAS, checked 30 Sept 2026 (how we verify). Permalink ·

A person bought a refrigerator worth ₹22,800 with 12.5% interest compounded yearly. At the end of first year he paid ₹8,650 and at the end of second year ₹9,125. How much will he have to pay at the end of third year to clear the debt?

Answer & explanation

Answer: (d) ₹11,250

Add a year's interest (12.5%, one-eighth) to the balance and subtract each payment. The balance falls to ₹17,000 after year 1 and ₹10,000 after year 2, so year 3 needs ₹10,000 × 1.125 = ₹11,250.

  1. Year 1: 22,800 × 1.125 = 25,650; after paying 8,650 the balance is 17,000.
  2. Year 2: 17,000 × 1.125 = 19,125; after paying 9,125 the balance is 10,000.
  3. Year 3: 10,000 × 1.125 = 11,250 clears the debt.
  4. Check: ₹10,000 is only the balance at the start of year 3; it still earns a year's interest.

Remember · For instalments at compound interest, roll the balance forward: add the year's interest, subtract the payment. 12.5% is one-eighth.

Question and answer: UPSC's official GS Paper II (2018, Series A) — paper ↗ · answer key ↗. Explanation: Minimalist IAS, checked 30 Sept 2026 (how we verify). Permalink ·

Consider the following figures:

Six circles (I)–(VI), each cut into six sectors by a horizontal line and two diagonals, holding a small square and a small triangle. Square: top, upper right, lower right, bottom, lower left, upper left. Triangle: lower left, bottom, lower right, upper right, top, upper left. The four options are drawn as circles too.
From UPSC's question paper.

In the figures (I) to (VI) above, some parts are shown to change their positions in regular directions. Following the same sequence, which of the figures given below will appear at (VII) stage?

Answer & explanation

Answer: (b) Figure: square in the top sector, triangle in the lower-left sector

The square moves one sector clockwise at each step and the triangle one sector anticlockwise. At stage (VII) the square returns to the top and the triangle to the lower left — option (b).

  1. Name the sectors clockwise: top, upper right, lower right, bottom, lower left, upper left.
  2. Square in (I)–(VI): top, upper right, lower right, bottom, lower left, upper left — one step clockwise each time.
  3. Triangle in (I)–(VI): lower left, bottom, lower right, upper right, top, upper left — one step anticlockwise each time.
  4. Stage (VII): the square moves from upper left to top; the triangle moves from upper left to lower left.
  5. Check: after six steps both are back where they were in (I), as expected in a six-sector circle.

Remember · Track each moving part separately — its direction and step size; after a full cycle the figure repeats.

Question and answer: UPSC's official GS Paper II (2018, Series A) — paper ↗ · answer key ↗. Explanation: Minimalist IAS, checked 1 Oct 2026 (how we verify). Permalink ·

Consider the following graphs. The curves in the graphs indicate different age groups in the populations of two countries A and B over a period of few decades:

With reference to the above graphs, which of the following are the most logical and rational inferences that can be made?

  1. 1.Over the last two and a half decades, the dependency ratio for country B has decreased.
  2. 2.By the end of next two and a half decades, the dependency ratio of country A will be much less than that of country B.
  3. 3.In the next two decades, the work-force relative to its total population will increase in country B as compared to country A.
Two line graphs, 1950–2050, of population (in millions) by age group (<15, 15–64, 64+). Country A: 15–64 rises to about 1.0 by 2010 and falls to about 0.87 by 2050; <15 drifts down from about 0.33 to 0.22; 64+ climbs past the <15 line around 2030 to about 0.34. Country B: 15–64 keeps rising to about 1.1 by 2050; <15 stays around 0.3–0.36; 64+ rises slowly to about 0.26.
From UPSC's question paper.

Select the correct answer using the code given below.

Answer & explanation

Answer: (c) 1 and 3 only

Dependency ratio = (under-15 + over-64) ÷ working-age (15–64). In B the working-age group grew much faster than the dependants over the past 25 years, so the ratio fell (1). Ahead, A's working-age group shrinks while its elderly grow, so A's ratio will not be much lower than B's (2 fails), and B's working-age share rises while A's falls (3).

  1. Dependency ratio = (<15 + 64+) ÷ (15–64).
  2. Country B, about 1990: (0.32 + 0.05) ÷ 0.54 ≈ 0.69; about 2015: (0.36 + 0.11) ÷ 0.84 ≈ 0.56 — decreased.
  3. Around 2043: A ≈ (0.23 + 0.31) ÷ 0.92 ≈ 0.59; B ≈ (0.32 + 0.22) ÷ 1.07 ≈ 0.50 — A's ratio is higher, not much lower.
  4. Working-age share, about 2018 → 2038: B ≈ 0.65 → 0.67 (up); A ≈ 0.68 → 0.65 (down).
  • ✓ 1. In B the 15–64 group grows from about 0.54 to 0.84 million over the period while dependants rise only from about 0.37 to 0.47, so the ratio falls.
  • ✗ 2. By the early 2040s A's elderly have overtaken its children and its working-age group is shrinking; its ratio (about 0.59) is above B's (about 0.50).
  • ✓ 3. B's working-age group keeps growing faster than its dependants, while A's working-age group declines and its elderly grow.

Remember · Dependency ratio = (children + elderly) ÷ working-age; read all three curves at both dates before judging the direction.

Question and answer: UPSC's official GS Paper II (2018, Series A) — paper ↗ · answer key ↗. Explanation: Minimalist IAS, checked 1 Oct 2026 (how we verify). Permalink ·

Lakshmi, her brother, her daughter and her son are badminton players. A game of doubles is about to begin:

  1. i.Lakshmi’s brother is directly across the net from her daughter.
  2. ii.Her son is diagonally across the net from the worst player’s sibling.
  3. iii.The best player and the worst player are on the same side of the net.

Who is the best player?

Answer & explanation

Answer: (a) Her brother

The brother and the daughter face each other, so Lakshmi and her son are also on opposite sides. Whichever side the son takes, clue (ii) puts the worst player on the brother's side of the net, and clue (iii) then makes the brother the best player.

  1. Siblings: Lakshmi and her brother; the daughter and the son.
  2. Clue (i): the brother and daughter are on opposite sides, directly facing; so Lakshmi and her son are on opposite sides too.
  3. Case 1 — the son partners the brother: the son is diagonally across from the daughter, so the worst player's sibling is the daughter and the worst is the son. By (iii) the best is his partner, the brother.
  4. Case 2 — the son partners the daughter: the son is diagonally across from the brother, so the worst player's sibling is the brother and the worst is Lakshmi. The best is her partner — again the brother.
  5. Both cases give the brother as the best player.

Remember · When the clues allow two layouts, work out both; if they agree on the person asked about, that is the answer.

Question and answer: UPSC's official GS Paper II (2018, Series A) — paper ↗ · answer key ↗. Explanation: Minimalist IAS, checked 30 Sept 2026 (how we verify). Permalink ·

The graph given below indicates the changes in key policy rates made by the Central Bank several times in a year:

Rate (%)Jul 2, 2010May 3, 2011Jun 16, 2011
Repo Rate5·507·257·50 (+·25)
Reverse Repo Rate4·006·256·50 (+·25)
CRR6·006·006·00 (0)
Line graph of key policy rates from 2 July 2010 to 16 June 2011: the repo rate rises in steps from 5.50% to 7.50% and the reverse repo rate from 4.00% to 6.50%, while the CRR stays flat at 6.00%; the table lists the values labelled on the graph.
From UPSC's question paper.

Which one of the following can be the most likely reason for the Central Bank for such an action?

Answer & explanation

Answer: (d) Anti-inflationary stance

The central bank raised the repo and reverse repo rates again and again — by 2 and 2.5 percentage points in under a year — while keeping CRR unchanged. Repeated rate hikes make borrowing dearer and pull money out of the system, the standard response to high inflation.

  1. Repo rate: 5.50% → 7.50%; reverse repo: 4.00% → 6.50%; CRR steady at 6.00%.
  2. Higher policy rates raise banks' cost of funds and lending rates, slowing credit and money supply.
  3. That tightens liquidity — the opposite of (b).
  4. Attracting foreign investment or savings is not the purpose of a year of repeated hikes; cooling demand and prices is — an anti-inflationary stance.

Remember · Rising repo and reverse repo rates mean tight money to fight inflation; falling rates mean easing to support growth and liquidity.

Question and answer: UPSC's official GS Paper II (2018, Series A) — paper ↗ · answer key ↗. Explanation: Minimalist IAS, checked 1 Oct 2026 (how we verify). Permalink ·

Directions for the following 2 (two) items: The following table gives the GDP growth rate and Tele-density data of different States of a country in a particular year. Study the table and answer the two items that follow.

With reference to the above table, which of the following is/are the most logical and rational inference/inferences that can be made?

  1. 1.Higher per capita income is generally associated with higher Tele-density.
  2. 2.Higher GDP growth rate always ensures higher per capita income.
  3. 3.Higher GDP growth rate does not necessarily ensure higher Tele-density.
StatesPer capita income ($)GDP growth rate (%)Tele-density
State 17049·5270·27
State 24195·3135·88
State 325410·8350·07
State 45459·785·94
State 589110·876·12
State 6107711·6977·5
State 79008·88104·86
State 83955·926
State 97207·7682·25
State 108939·5596·7
State 113634·757·7
State 129667·8563·8
State 134959·3752·3
State 148645·4697·9
State 154977·4862·3
State 167777·0393·8
State 173355·849·9
State 185997·4947·84
A table of 18 States giving per capita income ($), GDP growth rate (%) and tele-density.
From UPSC's question paper.

Select the correct answer using the code given below.

Answer & explanation

Answer: (c) 1 and 3

Sorted by income, the richer States mostly have high tele-density: the nine highest-income States average about 85, the nine lowest about 41. State 3, with the second-highest growth rate, has the lowest per capita income, which defeats 'always' in 2; State 4 grows at 9.78% with tele-density of only 5.94, confirming 3.

  1. Statement 1: the nine richest States (6, 12, 7, 10, 5, 14, 16, 9, 1) average tele-density of about 85; the nine poorest average about 41 — a general association.
  2. Statement 2: State 3 grows at 10.83% (second highest) but has the lowest per capita income, $254 — 'always' fails.
  3. Statement 3: State 4 grows at 9.78% with tele-density 5.94, while State 14 grows at 5.46% with 97.9 — high growth does not ensure high tele-density.
  • ✓ 1. Exceptions exist (State 3 at $254 has 50.07), but 'generally' allows them; income and tele-density clearly move together across the table.
  • ✗ 2. One counter-example is enough: State 3 has the second-highest growth and the lowest per capita income.
  • ✓ 3. State 4 (9.78% growth, 5.94 tele-density) shows high growth without high tele-density.

Remember · 'Generally' tolerates exceptions; 'always' falls to one counter-example. Scan the table for a single contradicting row.

Question and answer: UPSC's official GS Paper II (2018, Series A) — paper ↗ · answer key ↗. Explanation: Minimalist IAS, checked 1 Oct 2026 (how we verify). Permalink ·

Directions for the following 2 (two) items: The following table gives the GDP growth rate and Tele-density data of different States of a country in a particular year. Study the table and answer the two items that follow.

With reference to the above table, the following assumptions have been made:

  1. 1.Nowadays, prosperity of an already high performing State cannot be sustained without making further large investments in its telecom infrastructure.
  2. 2.Nowadays, a very high Tele-density is the most essential condition for promoting the business and economic growth in a State.
StatesPer capita income ($)GDP growth rate (%)Tele-density
State 17049·5270·27
State 24195·3135·88
State 325410·8350·07
State 45459·785·94
State 589110·876·12
State 6107711·6977·5
State 79008·88104·86
State 83955·926
State 97207·7682·25
State 108939·5596·7
State 113634·757·7
State 129667·8563·8
State 134959·3752·3
State 148645·4697·9
State 154977·4862·3
State 167777·0393·8
State 173355·849·9
State 185997·4947·84

Uses the same figure as Q74 ↑

Which of the above assumptions is/are valid?

Answer & explanation

Answer: (d) Neither 1 nor 2

The table records one year's figures; it cannot show what sustains prosperity or which condition growth needs most. Both statements make causal claims ('cannot be sustained without', 'most essential condition') that the data cannot bear — and the data even run against statement 2.

  • ✗ 1. A one-year snapshot says nothing about sustaining prosperity or the need for further telecom investment; the claim is a causal prediction beyond the table.
  • ✗ 2. The table shows high growth with very low tele-density (State 4: 9.78%, 5.94) and very high tele-density with modest growth (State 14: 5.46%, 97.9), so tele-density cannot be the most essential condition.

Remember · A single table shows associations, not causes; reject assumptions claiming 'cannot without' or 'most essential' from it.

Question and answer: UPSC's official GS Paper II (2018, Series A) — paper ↗ · answer key ↗. Explanation: Minimalist IAS, checked 1 Oct 2026 (how we verify). Permalink ·

The following graph indicates the composition of our tax revenue for a period of two decades:

With reference to the above graph, which of the following is/are the most logical and rational inference/inferences that can be made?

  1. 1.During the given period, the revenue from Direct Taxes as percentage of gross tax revenue has increased while that of Indirect Taxes decreased.
  2. 2.The trend in the revenue from Excise Duty demonstrates that the growth of manufacturing sector has been negative during the given period.
Line graph, 1990-91 to 2010-11 (BE), of each tax's per cent share of gross tax revenue: excise falls from about 42 to about 19, customs from about 36 to about 17, corporate tax rises from about 9 to about 42, personal income tax from about 9 to about 18, and service tax from 0 to about 11.
From UPSC's question paper.

Select the correct answer using the code given below.

Answer & explanation

Answer: (a) 1 only

Corporate and personal income tax (direct taxes) together rise from about 19% to about 60% of gross tax revenue, while excise, customs and service tax (indirect) fall from about 78% to about 48% — statement 1. A falling share of excise says nothing about whether manufacturing shrank, so statement 2 does not follow.

  1. Direct taxes: corporate (about 9 → 42) + personal income tax (about 9 → 18) = about 19% → 60%.
  2. Indirect taxes: excise (42 → 19) + customs (36 → 17) + service tax (0 → 11) = about 78% → 48%.
  3. The graph gives shares of the total, not amounts collected.
  • ✓ 1. The direct-tax share roughly triples while the indirect-tax share falls by about 30 points.
  • ✗ 2. Excise's share can fall while its collections and manufacturing output grow, for example if direct taxes grow faster or duty rates are cut; a share graph cannot show negative growth.

Remember · A falling share is not a falling amount — percentage-composition graphs cannot show absolute decline.

Question and answer: UPSC's official GS Paper II (2018, Series A) — paper ↗ · answer key ↗. Explanation: Minimalist IAS, checked 1 Oct 2026 (how we verify). Permalink ·

If x − y = 8, then which of the following must be true?

  1. 1.Both x and y must be positive for any value of x and y.
  2. 2.If x is positive, y must be negative for any value of x and y.
  3. 3.If x is negative, y must be positive for any value of x and y.

Select the correct answer using the code given below.

Answer & explanation

Answer: (d) Neither 1 nor 2 nor 3

y is always 8 less than x. When x is positive, y can be positive or negative (x = 10, y = 2; x = 2, y = −6), and when x is negative, y is even more negative. None of the three statements must hold.

  1. Rewrite the condition as y = x − 8.
  2. x = 2 gives y = −6: both need not be positive.
  3. x = 10 gives y = 2: y need not be negative when x is positive.
  4. If x is negative, y = x − 8 is below −8, so y can never be positive.
  • ✗ 1. x = 2, y = −6 satisfies x − y = 8 with y negative.
  • ✗ 2. x = 10, y = 2 satisfies the equation with both positive.
  • ✗ 3. A negative x makes y = x − 8 even more negative, never positive.

Remember · For 'must be true' statements, one counter-example disproves each; express one variable in terms of the other first.

Question and answer: UPSC's official GS Paper II (2018, Series A) — paper ↗ · answer key ↗. Explanation: Minimalist IAS, checked 30 Sept 2026 (how we verify). Permalink ·

Directions for the following 3 (three) items: Read the following two passages and answer the items that follow. Your answers to these items should be based on the passages only.

Passage—1

The quest for cheap and plentiful meat has resulted in factory farms where more and more animals are squeezed into smaller lots in cruel and shocking conditions. Such practices have resulted in many of the world’s health pandemics such as the avian flu. Worldwide, livestock are increasingly raised in cruel, cramped conditions, where animals spend their short lives under artificial light, pumped full of antibiotics and growth hormones, until the day they are slaughtered. Meat production is water-intensive. 15000 litres of water is needed for every kilogram of meat compared with 3400 litres for rice, 3300 litres for eggs and 255 litres for a kilogram of potatoes.

What is the most rational and crucial message given by the passage?

Answer & explanation

Answer: (d) Environmental cost of meat production is unsustainable when it is produced through industrial farming.

The passage describes factory farming's cruelty and health risks and ends on its water cost — 15000 litres per kilogram of meat against 255 for potatoes. The crucial message is that industrially produced meat carries an unsustainable environmental cost.

  • ✗ (a) The quest for 'cheap and plentiful meat' is mentioned only to criticise where it has led; nothing recommends it for poor countries.
  • ✗ (b) Conditions are called 'cruel', but the passage never mentions laws or their violation.
  • ✗ (c) The passage criticises industrial farming but calls for no immediate stop; the option goes further than the text.
  • ✓ (d) The passage's evidence builds to this: meat is 'water-intensive', needing 15000 litres a kilogram against far less for rice, eggs or potatoes — a cost industrial scale makes unsustainable.

Remember · Choose the message the passage's evidence builds towards; avoid options that add legal claims or drastic prescriptions.

Question and answer: UPSC's official GS Paper II (2018, Series A) — paper ↗ · answer key ↗. Explanation: Minimalist IAS, checked 30 Sept 2026 (how we verify). Permalink ·

Passage—2

A male tiger was removed from Pench Tiger Reserve and was relocated in Panna National Park. Later, this tiger trekked toward his home 250 miles away. The trek of this solitary tiger highlights a crisis. Many wildlife reserves exist as islands of fragile habitat in a vast sea of humanity, yet tigers can range over a hundred miles, seeking prey, mates and territory. Nearly a third of India’s tigers live outside tiger reserves, a situation that is dangerous for both human and animal. Prey and tigers can only disperse if there are recognized corridors of land between protected areas to allow unmolested passage.

Which of the following is the most rational and crucial message given by the passage?

Answer & explanation

Answer: (b) Safe wildlife corridors between protected areas is an essential aspect of conservation efforts.

Reserves are islands in a sea of people, yet tigers range widely and a third of them live outside reserves. The passage concludes that prey and tigers can disperse only through recognised corridors between protected areas — option (b).

  • ✗ (a) The passage offers a remedy — corridors — so it does not call the conflict unresolvable.
  • ✓ (b) The last sentence: prey and tigers 'can only disperse if there are recognized corridors of land between protected areas'.
  • ✗ (c) The problem is the isolation of existing reserves, not their number; more reserves are never proposed.
  • ✗ (d) Management of parks is not discussed; the issue is connectivity between protected areas.

Remember · A passage's closing solution sentence often carries its crucial message; drop options that add remedies it never mentions.

Question and answer: UPSC's official GS Paper II (2018, Series A) — paper ↗ · answer key ↗. Explanation: Minimalist IAS, checked 30 Sept 2026 (how we verify). Permalink ·

With reference to the above passage, the following assumptions have been made:

  1. 1.The strategy of conservation of wildlife by relocating them from one protected area to another is not often successful.
  2. 2.India does not have suitable legislation to save the tigers, and its conservation efforts have failed which forced the tigers to live outside protected areas.

Which of the above assumptions is/are valid?

Answer & explanation

Answer: (a) 1 only

Why not the tempting option · UPSC's key takes statement 1 as the assumption behind the author's use of the Panna tiger: if relocating tigers between isolated reserves usually worked, one tiger's trek home would not 'highlight a crisis'. A strict reader may object that one case cannot show relocation is 'not often' successful, but in CSAT an assumption is valid when the author's argument leans on it, and this author presents the case as typical. Statement 2 brings in legislation, which the passage never mentions, so (a) is the best answer.

The author offers the relocated tiger's 250-mile trek home as a sign of 'a crisis', which only works if moving tigers between isolated reserves usually does not hold them, which is statement 1. Legislation is never mentioned, and tigers live outside reserves because they range over a hundred miles, not because conservation has failed, so statement 2 is invalid.

  • ✓ 1. The tiger moved from Pench to Panna headed back towards home, and the author calls the trek a 'crisis'; using one relocation as a warning assumes such relocations are not often successful.
  • ✗ 2. Laws are never mentioned; the passage explains tigers outside reserves by their wide range and by reserves being 'islands' without corridors, not by failed conservation.

Remember · An assumption is what the author must believe to use an example as evidence; claims about laws or failures the passage never raises are invalid.

Question and answer: UPSC's official GS Paper II (2018, Series A) — paper ↗ · answer key ↗. Explanation: Minimalist IAS, checked 1 Oct 2026 (how we verify). Permalink ·