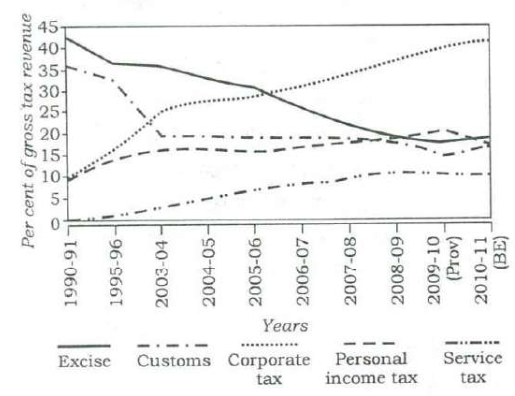
The following graph indicates the composition of our tax revenue for a period of two decades:
With reference to the above graph, which of the following is/are the most logical and rational inference/inferences that can be made?
- 1.During the given period, the revenue from Direct Taxes as percentage of gross tax revenue has increased while that of Indirect Taxes decreased.
- 2.The trend in the revenue from Excise Duty demonstrates that the growth of manufacturing sector has been negative during the given period.
Select the correct answer using the code given below.
Answer & explanation
Answer: (a) 1 only
Corporate and personal income tax (direct taxes) together rise from about 19% to about 60% of gross tax revenue, while excise, customs and service tax (indirect) fall from about 78% to about 48% — statement 1. A falling share of excise says nothing about whether manufacturing shrank, so statement 2 does not follow.
- Direct taxes: corporate (about 9 → 42) + personal income tax (about 9 → 18) = about 19% → 60%.
- Indirect taxes: excise (42 → 19) + customs (36 → 17) + service tax (0 → 11) = about 78% → 48%.
- The graph gives shares of the total, not amounts collected.
- ✓ 1. The direct-tax share roughly triples while the indirect-tax share falls by about 30 points.
- ✗ 2. Excise's share can fall while its collections and manufacturing output grow, for example if direct taxes grow faster or duty rates are cut; a share graph cannot show negative growth.
Remember · A falling share is not a falling amount — percentage-composition graphs cannot show absolute decline.
Question and answer: UPSC's official GS Paper II (2018, Series A) — paper ↗ · answer key ↗. Explanation: Minimalist IAS, checked 1 Oct 2026 (how we verify). ·