Directions for the following 2 (two) items: The following table gives the GDP growth rate and Tele-density data of different States of a country in a particular year. Study the table and answer the two items that follow.
With reference to the above table, the following assumptions have been made:
- 1.Nowadays, prosperity of an already high performing State cannot be sustained without making further large investments in its telecom infrastructure.
- 2.Nowadays, a very high Tele-density is the most essential condition for promoting the business and economic growth in a State.
| States | Per capita income ($) | GDP growth rate (%) | Tele-density |
|---|---|---|---|
| State 1 | 704 | 9·52 | 70·27 |
| State 2 | 419 | 5·31 | 35·88 |
| State 3 | 254 | 10·83 | 50·07 |
| State 4 | 545 | 9·78 | 5·94 |
| State 5 | 891 | 10·8 | 76·12 |
| State 6 | 1077 | 11·69 | 77·5 |
| State 7 | 900 | 8·88 | 104·86 |
| State 8 | 395 | 5·92 | 6 |
| State 9 | 720 | 7·76 | 82·25 |
| State 10 | 893 | 9·55 | 96·7 |
| State 11 | 363 | 4·7 | 57·7 |
| State 12 | 966 | 7·85 | 63·8 |
| State 13 | 495 | 9·37 | 52·3 |
| State 14 | 864 | 5·46 | 97·9 |
| State 15 | 497 | 7·48 | 62·3 |
| State 16 | 777 | 7·03 | 93·8 |
| State 17 | 335 | 5·8 | 49·9 |
| State 18 | 599 | 7·49 | 47·84 |
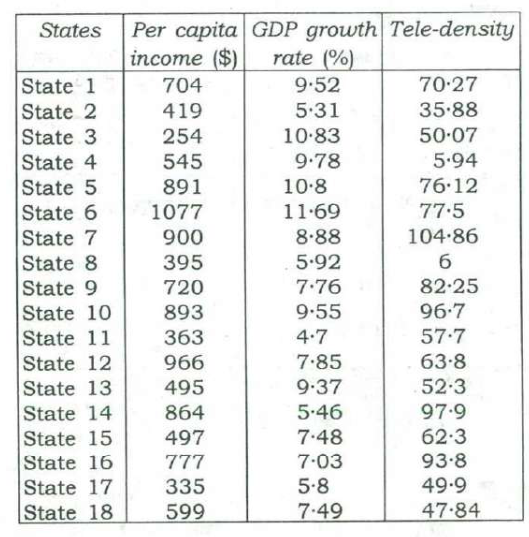
Which of the above assumptions is/are valid?
Answer & explanation
Answer: (d) Neither 1 nor 2
The table records one year's figures; it cannot show what sustains prosperity or which condition growth needs most. Both statements make causal claims ('cannot be sustained without', 'most essential condition') that the data cannot bear — and the data even run against statement 2.
- ✗ 1. A one-year snapshot says nothing about sustaining prosperity or the need for further telecom investment; the claim is a causal prediction beyond the table.
- ✗ 2. The table shows high growth with very low tele-density (State 4: 9.78%, 5.94) and very high tele-density with modest growth (State 14: 5.46%, 97.9), so tele-density cannot be the most essential condition.
Remember · A single table shows associations, not causes; reject assumptions claiming 'cannot without' or 'most essential' from it.
Question and answer: UPSC's official GS Paper II (2018, Series A) — paper ↗ · answer key ↗. Explanation: Minimalist IAS, checked 1 Oct 2026 (how we verify). ·