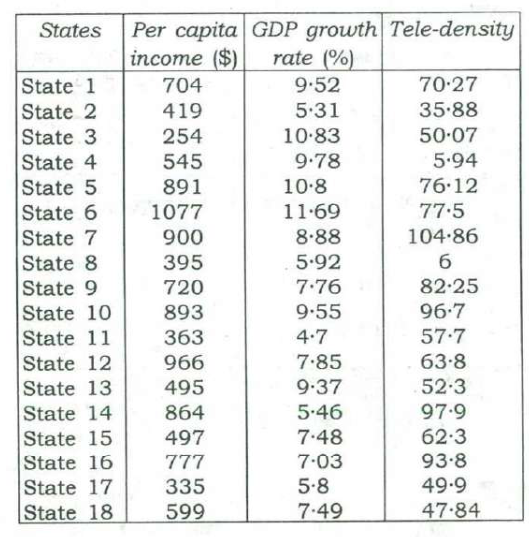
Directions for the following 2 (two) items: The following table gives the GDP growth rate and Tele-density data of different States of a country in a particular year. Study the table and answer the two items that follow.
With reference to the above table, which of the following is/are the most logical and rational inference/inferences that can be made?
- 1.Higher per capita income is generally associated with higher Tele-density.
- 2.Higher GDP growth rate always ensures higher per capita income.
- 3.Higher GDP growth rate does not necessarily ensure higher Tele-density.
| States | Per capita income ($) | GDP growth rate (%) | Tele-density |
|---|---|---|---|
| State 1 | 704 | 9·52 | 70·27 |
| State 2 | 419 | 5·31 | 35·88 |
| State 3 | 254 | 10·83 | 50·07 |
| State 4 | 545 | 9·78 | 5·94 |
| State 5 | 891 | 10·8 | 76·12 |
| State 6 | 1077 | 11·69 | 77·5 |
| State 7 | 900 | 8·88 | 104·86 |
| State 8 | 395 | 5·92 | 6 |
| State 9 | 720 | 7·76 | 82·25 |
| State 10 | 893 | 9·55 | 96·7 |
| State 11 | 363 | 4·7 | 57·7 |
| State 12 | 966 | 7·85 | 63·8 |
| State 13 | 495 | 9·37 | 52·3 |
| State 14 | 864 | 5·46 | 97·9 |
| State 15 | 497 | 7·48 | 62·3 |
| State 16 | 777 | 7·03 | 93·8 |
| State 17 | 335 | 5·8 | 49·9 |
| State 18 | 599 | 7·49 | 47·84 |
Select the correct answer using the code given below.
Answer & explanation
Answer: (c) 1 and 3
Sorted by income, the richer States mostly have high tele-density: the nine highest-income States average about 85, the nine lowest about 41. State 3, with the second-highest growth rate, has the lowest per capita income, which defeats 'always' in 2; State 4 grows at 9.78% with tele-density of only 5.94, confirming 3.
- Statement 1: the nine richest States (6, 12, 7, 10, 5, 14, 16, 9, 1) average tele-density of about 85; the nine poorest average about 41 — a general association.
- Statement 2: State 3 grows at 10.83% (second highest) but has the lowest per capita income, $254 — 'always' fails.
- Statement 3: State 4 grows at 9.78% with tele-density 5.94, while State 14 grows at 5.46% with 97.9 — high growth does not ensure high tele-density.
- ✓ 1. Exceptions exist (State 3 at $254 has 50.07), but 'generally' allows them; income and tele-density clearly move together across the table.
- ✗ 2. One counter-example is enough: State 3 has the second-highest growth and the lowest per capita income.
- ✓ 3. State 4 (9.78% growth, 5.94 tele-density) shows high growth without high tele-density.
Remember · 'Generally' tolerates exceptions; 'always' falls to one counter-example. Scan the table for a single contradicting row.
Question and answer: UPSC's official GS Paper II (2018, Series A) — paper ↗ · answer key ↗. Explanation: Minimalist IAS, checked 1 Oct 2026 (how we verify). ·