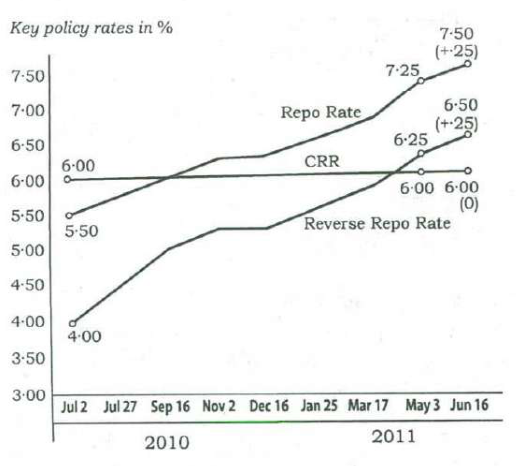
The graph given below indicates the changes in key policy rates made by the Central Bank several times in a year:
| Rate (%) | Jul 2, 2010 | May 3, 2011 | Jun 16, 2011 |
|---|---|---|---|
| Repo Rate | 5·50 | 7·25 | 7·50 (+·25) |
| Reverse Repo Rate | 4·00 | 6·25 | 6·50 (+·25) |
| CRR | 6·00 | 6·00 | 6·00 (0) |
Which one of the following can be the most likely reason for the Central Bank for such an action?
Answer & explanation
Answer: (d) Anti-inflationary stance
The central bank raised the repo and reverse repo rates again and again — by 2 and 2.5 percentage points in under a year — while keeping CRR unchanged. Repeated rate hikes make borrowing dearer and pull money out of the system, the standard response to high inflation.
- Repo rate: 5.50% → 7.50%; reverse repo: 4.00% → 6.50%; CRR steady at 6.00%.
- Higher policy rates raise banks' cost of funds and lending rates, slowing credit and money supply.
- That tightens liquidity — the opposite of (b).
- Attracting foreign investment or savings is not the purpose of a year of repeated hikes; cooling demand and prices is — an anti-inflationary stance.
Remember · Rising repo and reverse repo rates mean tight money to fight inflation; falling rates mean easing to support growth and liquidity.
Question and answer: UPSC's official GS Paper II (2018, Series A) — paper ↗ · answer key ↗. Explanation: Minimalist IAS, checked 1 Oct 2026 (how we verify). ·