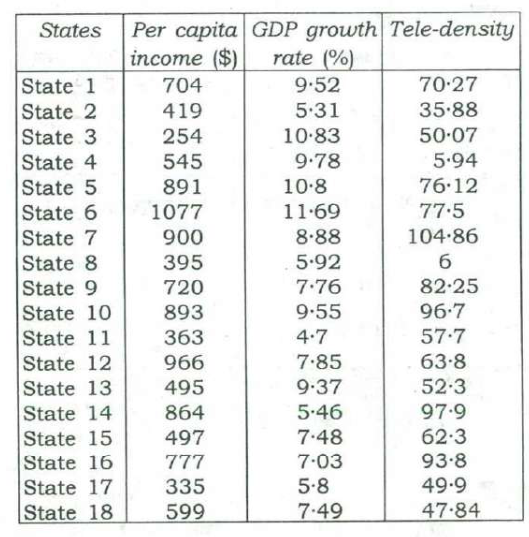
निम्नलिखित 2 (दो) प्रश्नांशों के लिए निर्देश : नीचे दी गई तालिका में किसी विशेष वर्ष में किसी देश के विभिन्न राज्यों की जी॰ डी॰ पी॰ वृद्धि-दर और दूरसंचार सघनता आँकड़े दिखाए गए हैं। इस तालिका का अध्ययन कीजिए और आगे आने वाले दो प्रश्नांशों के उत्तर दीजिए।
ऊपर दी गई तालिका के संदर्भ में, निम्नलिखित पूर्वधारणाएँ बनाई गई हैं :
- 1.आजकल, पहले से ही उच्च निष्पादन करने वाले किसी राज्य की संपन्नता दूरसंचार अवसंरचना में वृहत् निवेशों को जारी रखे बिना कायम नहीं रखी जा सकती।
- 2.आजकल, बहुत उच्च दूरसंचार सघनता किसी राज्य में व्यवसाय एवं आर्थिक विकास को प्रोत्साहित करने के लिए एक सबसे महत्त्वपूर्ण शर्त है।
| राज्य | प्रति व्यक्ति आय ($) | जी॰ डी॰ पी॰ वृद्धि-दर (%) | दूरसंचार सघनता |
|---|---|---|---|
| राज्य 1 | 704 | 9·52 | 70·27 |
| राज्य 2 | 419 | 5·31 | 35·88 |
| राज्य 3 | 254 | 10·83 | 50·07 |
| राज्य 4 | 545 | 9·78 | 5·94 |
| राज्य 5 | 891 | 10·8 | 76·12 |
| राज्य 6 | 1077 | 11·69 | 77·5 |
| राज्य 7 | 900 | 8·88 | 104·86 |
| राज्य 8 | 395 | 5·92 | 6 |
| राज्य 9 | 720 | 7·76 | 82·25 |
| राज्य 10 | 893 | 9·55 | 96·7 |
| राज्य 11 | 363 | 4·7 | 57·7 |
| राज्य 12 | 966 | 7·85 | 63·8 |
| राज्य 13 | 495 | 9·37 | 52·3 |
| राज्य 14 | 864 | 5·46 | 97·9 |
| राज्य 15 | 497 | 7·48 | 62·3 |
| राज्य 16 | 777 | 7·03 | 93·8 |
| राज्य 17 | 335 | 5·8 | 49·9 |
| राज्य 18 | 599 | 7·49 | 47·84 |
उपर्युक्त में से कौन-सी पूर्वधारणा/पूर्वधारणाएँ वैध है/हैं?
Read this question in English
Directions for the following 2 (two) items: The following table gives the GDP growth rate and Tele-density data of different States of a country in a particular year. Study the table and answer the two items that follow.
With reference to the above table, the following assumptions have been made:
1. Nowadays, prosperity of an already high performing State cannot be sustained without making further large investments in its telecom infrastructure.
2. Nowadays, a very high Tele-density is the most essential condition for promoting the business and economic growth in a State.
Which of the above assumptions is/are valid?
(a) 1 only · (b) 2 only · (c) Both 1 and 2 · (d) Neither 1 nor 2
उत्तर और व्याख्या · explanation in English
Answer: (d) न तो 1 और न ही 2
The table records one year's figures; it cannot show what sustains prosperity or which condition growth needs most. Both statements make causal claims ('cannot be sustained without', 'most essential condition') that the data cannot bear — and the data even run against statement 2.
- ✗ 1. A one-year snapshot says nothing about sustaining prosperity or the need for further telecom investment; the claim is a causal prediction beyond the table.
- ✗ 2. The table shows high growth with very low tele-density (State 4: 9.78%, 5.94) and very high tele-density with modest growth (State 14: 5.46%, 97.9), so tele-density cannot be the most essential condition.
Remember · A single table shows associations, not causes; reject assumptions claiming 'cannot without' or 'most essential' from it.
Question and answer: UPSC's official GS Paper II (2018, Series A) — paper ↗ · answer key ↗. Explanation: Minimalist IAS, checked 1 Oct 2026 (how we verify). ·