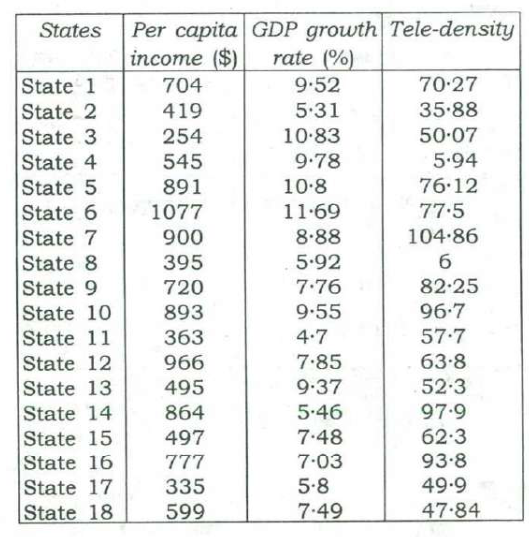
निम्नलिखित 2 (दो) प्रश्नांशों के लिए निर्देश : नीचे दी गई तालिका में किसी विशेष वर्ष में किसी देश के विभिन्न राज्यों की जी॰ डी॰ पी॰ वृद्धि-दर और दूरसंचार सघनता आँकड़े दिखाए गए हैं। इस तालिका का अध्ययन कीजिए और आगे आने वाले दो प्रश्नांशों के उत्तर दीजिए।
ऊपर दी गई तालिका के संदर्भ में, निम्नलिखित में से कौन-सा/से सर्वाधिक तार्किक और तर्कसंगत निष्कर्ष (इंफेरेंस) निकाला जा सकता है/निकाले जा सकते हैं?
- 1.उच्चतर प्रति व्यक्ति आय सामान्यतः उच्चतर दूरसंचार सघनता से संबद्ध होती है।
- 2.उच्चतर जी॰ डी॰ पी॰ वृद्धि-दर सदा उच्चतर प्रति व्यक्ति आय को सुनिश्चित करती है।
- 3.उच्चतर जी॰ डी॰ पी॰ वृद्धि-दर उच्चतर दूरसंचार सघनता को आवश्यक रूप से सुनिश्चित नहीं करती।
| राज्य | प्रति व्यक्ति आय ($) | जी॰ डी॰ पी॰ वृद्धि-दर (%) | दूरसंचार सघनता |
|---|---|---|---|
| राज्य 1 | 704 | 9·52 | 70·27 |
| राज्य 2 | 419 | 5·31 | 35·88 |
| राज्य 3 | 254 | 10·83 | 50·07 |
| राज्य 4 | 545 | 9·78 | 5·94 |
| राज्य 5 | 891 | 10·8 | 76·12 |
| राज्य 6 | 1077 | 11·69 | 77·5 |
| राज्य 7 | 900 | 8·88 | 104·86 |
| राज्य 8 | 395 | 5·92 | 6 |
| राज्य 9 | 720 | 7·76 | 82·25 |
| राज्य 10 | 893 | 9·55 | 96·7 |
| राज्य 11 | 363 | 4·7 | 57·7 |
| राज्य 12 | 966 | 7·85 | 63·8 |
| राज्य 13 | 495 | 9·37 | 52·3 |
| राज्य 14 | 864 | 5·46 | 97·9 |
| राज्य 15 | 497 | 7·48 | 62·3 |
| राज्य 16 | 777 | 7·03 | 93·8 |
| राज्य 17 | 335 | 5·8 | 49·9 |
| राज्य 18 | 599 | 7·49 | 47·84 |
नीचे दिए गए कूट का प्रयोग कर सही उत्तर चुनिए।
Read this question in English
Directions for the following 2 (two) items: The following table gives the GDP growth rate and Tele-density data of different States of a country in a particular year. Study the table and answer the two items that follow.
With reference to the above table, which of the following is/are the most logical and rational inference/inferences that can be made?
1. Higher per capita income is generally associated with higher Tele-density.
2. Higher GDP growth rate always ensures higher per capita income.
3. Higher GDP growth rate does not necessarily ensure higher Tele-density.
Select the correct answer using the code given below.
(a) 1 only · (b) 2 and 3 · (c) 1 and 3 · (d) 3 only
उत्तर और व्याख्या · explanation in English
Answer: (c) 1 और 3
Sorted by income, the richer States mostly have high tele-density: the nine highest-income States average about 85, the nine lowest about 41. State 3, with the second-highest growth rate, has the lowest per capita income, which defeats 'always' in 2; State 4 grows at 9.78% with tele-density of only 5.94, confirming 3.
- Statement 1: the nine richest States (6, 12, 7, 10, 5, 14, 16, 9, 1) average tele-density of about 85; the nine poorest average about 41 — a general association.
- Statement 2: State 3 grows at 10.83% (second highest) but has the lowest per capita income, $254 — 'always' fails.
- Statement 3: State 4 grows at 9.78% with tele-density 5.94, while State 14 grows at 5.46% with 97.9 — high growth does not ensure high tele-density.
- ✓ 1. Exceptions exist (State 3 at $254 has 50.07), but 'generally' allows them; income and tele-density clearly move together across the table.
- ✗ 2. One counter-example is enough: State 3 has the second-highest growth and the lowest per capita income.
- ✓ 3. State 4 (9.78% growth, 5.94 tele-density) shows high growth without high tele-density.
Remember · 'Generally' tolerates exceptions; 'always' falls to one counter-example. Scan the table for a single contradicting row.
Question and answer: UPSC's official GS Paper II (2018, Series A) — paper ↗ · answer key ↗. Explanation: Minimalist IAS, checked 1 Oct 2026 (how we verify). ·