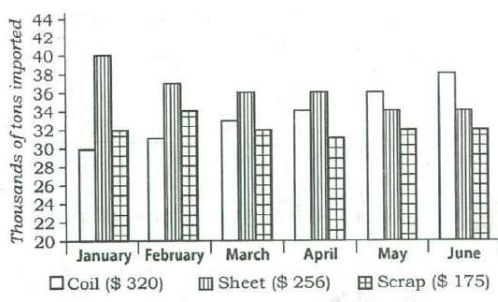
Directions for the following 3 (three) items: The following three items are based on the graph given below which shows imports of three different types of steel over a period of six months of a year. Study the graph and answer the three items that follow.
The figures in the brackets indicate the average cost per ton over six months period.
| Month | Coil ($ 320) | Sheet ($ 256) | Scrap ($ 175) |
|---|---|---|---|
| January | 30 | 40 | 32 |
| February | 31 | 37 | 34 |
| March | 33 | 36 | 32 |
| April | 34 | 36 | 31 |
| May | 36 | 34 | 32 |
| June | 38 | 34 | 32 |
What was the approximate ratio of sheet steel and scrap steel imports in the first three months of the year?
Answer & explanation
Answer: (b) 1.2: 1
In January–March, sheet imports total 113 and scrap imports 32 + 34 + 32 = 98 thousand tons. 113 ÷ 98 is about 1.15, which is closest to 1.2 : 1.
- Sheet, January–March: 40 + 37 + 36 = 113.
- Scrap, January–March: 32 + 34 + 32 = 98.
- 113 ÷ 98 ≈ 1.15, so the ratio is about 1.2 : 1.
- Check: 1.4 : 1 would need sheet near 137, and 1 : 1 would need equal totals — neither fits.
Remember · For an approximate ratio, divide the two totals once and choose the nearest option.
Question and answer: UPSC's official GS Paper II (2018, Series A) — paper ↗ · answer key ↗. Explanation: Minimalist IAS, checked 1 Oct 2026 (how we verify). ·