Consider the following graph:
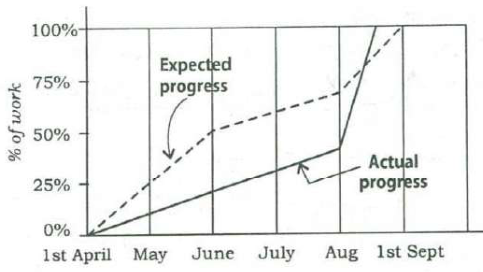
Which one of the following statements is not correct with reference to the graph given above?
Answer & explanation
Answer: (d) During the period from 1st April to 1st September, at no time was the actual progress more than the expected progress.
In August the actual-progress line shoots up, crosses above the expected line and reaches 100% before 1st September. So for a while actual progress did exceed expected progress, which makes statement (d) the incorrect one.
- (a) On 1st June actual progress is about 22% against an expected 50% — true.
- (b) The actual line is steepest in August, rising from about 42% to 100% — true.
- (c) Actual progress reaches 100% during August, before the expected finish on 1st September — true.
- (d) In late August the actual line crosses above the expected line, so actual progress was more than expected for a time — false.
- The statement that is not correct is (d).
Remember · In 'not correct' graph items, test every option against the picture, and look closely where two lines cross.
Question and answer: UPSC's official GS Paper II (2018, Series A) — paper ↗ · answer key ↗. Explanation: Minimalist IAS, checked 1 Oct 2026 (how we verify). ·