नीचे दिए गए आलेख (ग्राफ) पर विचार कीजिए :
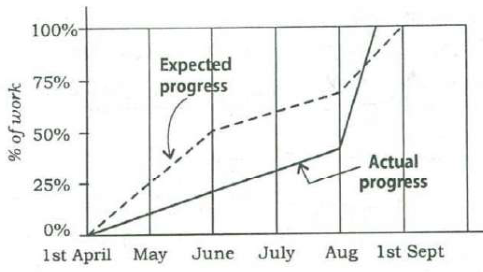
निम्नलिखित में से कौन-सा कथन ऊपर दिए गए आलेख के संदर्भ में सही नहीं है?
Read this question in English
Consider the following graph:
Which one of the following statements is not correct with reference to the graph given above?
(a) On 1st June, the actual progress of work was less than expected. · (b) The actual rate of progress of work was the greatest during the month of August. · (c) The work was actually completed before the expected time. · (d) During the period from 1st April to 1st September, at no time was the actual progress more than the expected progress.
उत्तर और व्याख्या · explanation in English
Answer: (d) 1 अप्रैल से 1 सितम्बर की अवधि में किसी भी समय वास्तविक प्रगति अपेक्षित प्रगति से अधिक नहीं थी।
In August the actual-progress line shoots up, crosses above the expected line and reaches 100% before 1st September. So for a while actual progress did exceed expected progress, which makes statement (d) the incorrect one.
- (a) On 1st June actual progress is about 22% against an expected 50% — true.
- (b) The actual line is steepest in August, rising from about 42% to 100% — true.
- (c) Actual progress reaches 100% during August, before the expected finish on 1st September — true.
- (d) In late August the actual line crosses above the expected line, so actual progress was more than expected for a time — false.
- The statement that is not correct is (d).
Remember · In 'not correct' graph items, test every option against the picture, and look closely where two lines cross.
Question and answer: UPSC's official GS Paper II (2018, Series A) — paper ↗ · answer key ↗. Explanation: Minimalist IAS, checked 1 Oct 2026 (how we verify). ·