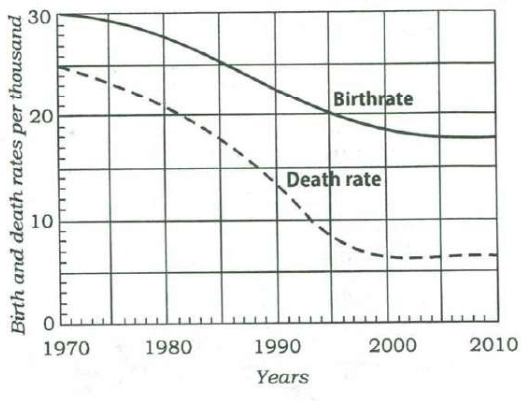
Directions for the following 2 (two) items: Consider the following graph in which the birthrate and death rate of a country are given, and answer the two items that follow.
With reference to the above graph, consider the following statements considering 1970 as base year:
- 1.Population has stabilized after 35 years.
- 2.Population growth rate has stabilized after 35 years.
- 3.Death rate has fallen by 10% in the first 10 years.
- 4.Birthrate has stabilized after 35 years.
Which of the above are the most logical and rational statements that can be made from the above graph?
Answer & explanation
Answer: (d) 2 and 4
From 2005 (35 years after 1970) both curves flatten — the birthrate near 18 and the death rate near 6.5–7 — so the birthrate and the growth rate (their gap) have stabilised. The population itself keeps growing, and the death rate fell by much more than 10% in 1970–80.
- 35 years after 1970 is 2005; compare the curves from 2005 to 2010.
- Birthrate: about 18 throughout; death rate: about 6.5 to 7; gap about 11 throughout.
- 1970–80: death rate from 25 to about 21, a fall of about 16%.
- ✗ 1. Births stay well above deaths after 2005, so the population keeps growing; only its growth rate is steady.
- ✓ 2. After 2005 the gap between the curves stays at about 11 per thousand, so the growth rate has stabilised.
- ✗ 3. The death rate falls from 25 to about 21 per thousand in 1970–80, about 16% (4 points), not 10%.
- ✓ 4. The birthrate curve runs flat at about 18 per thousand from 2005 to 2010.
Remember · A steady growth rate is not a steady population; population stops growing only when births equal deaths.
Question and answer: UPSC's official GS Paper II (2018, Series A) — paper ↗ · answer key ↗. Explanation: Minimalist IAS, checked 1 Oct 2026 (how we verify). ·