Directions for the following 2 (two) items: Consider the following graph in which the birthrate and death rate of a country are given, and answer the two items that follow.
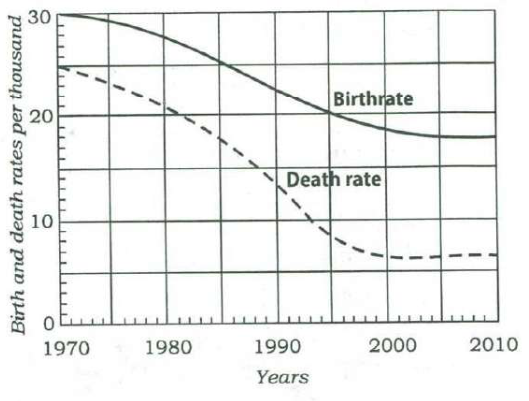
Looking at the graph, it can be inferred that from 1990 to 2010
Answer & explanation
Answer: (d) population growth rate shows no trend
Why not the tempting option · UPSC's key is (d). The gap between the two curves, which is the growth rate, widens from about 8.5 per thousand in 1990 to about 11.5 in 2000, then flattens and eases slightly to about 11 by 2010, so there is no single direction across 1990–2010. 'Has increased' is tempting because 2010 sits higher than 1990, but the rise ends at 2000 and the gap drifts down after that. In the exam, read a trend over a stated period as one consistent direction across the whole period, as UPSC does; its key to the next item likewise treats the growth rate as having stabilised after 2005.
The population growth rate is the gap between the birthrate and the death rate. From 1990 the gap widens, from about 8.5 to about 11.5 per thousand by 2000, and then flattens and eases slightly to about 11 by 2010. A rise followed by a plateau is not a single direction, so over 1990–2010 the growth rate shows no trend: (d).
- Natural growth rate = birthrate − death rate: the vertical gap between the two curves.
- 1990: about 22.5 − 14 = 8.5 per thousand. 1995: about 20 − 9.5 = 10.5.
- 2000: about 18.5 − 7 = 11.5. 2005: about 18 − 6.5 = 11.5. 2010: about 18 − 7 = 11.
- So the gap rises through the 1990s, then stops rising and dips a little through the 2000s.
- 'Increased' needs the rise to run through the whole period, but it ends at 2000; 'decreased' and 'stable' fail for the 1990s. A rise that then levels off is no single trend: (d).
Remember · Population growth rate = birth rate − death rate: read the gap between the curves, not the curves themselves. A rise that then levels off is 'no trend' over the whole period, not 'increased'.
Question and answer: UPSC's official GS Paper II (2018, Series A) — paper ↗ · answer key ↗. Explanation: Minimalist IAS, checked 1 Oct 2026 (how we verify). ·