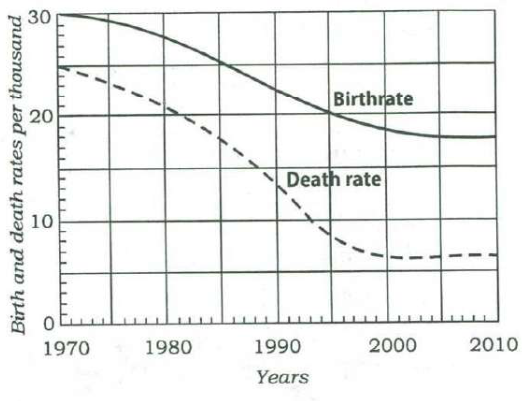
निम्नलिखित 2 (दो) प्रश्नांशों के लिए निर्देश : नीचे दिए गए आलेख (ग्राफ) पर विचार कीजिए जिसमें किसी देश की जन्मदर और मृत्युदर दी गई हैं, और उसके आगे आने वाले दो प्रश्नांशों के उत्तर दीजिए :
ऊपर दिए गए आलेख के संदर्भ में, 1970 को आधार वर्ष मानकर निम्नलिखित कथनों पर विचार कीजिए :
- 1.35 वर्षों के पश्चात् जनसंख्या स्थिर हो गई है।
- 2.35 वर्षों के पश्चात् जनसंख्या वृद्धि-दर स्थिर हो गई है।
- 3.पहले 10 वर्षों में मृत्युदर में 10% की गिरावट हुई है।
- 4.35 वर्षों के बाद जन्मदर स्थिर हो गई है।
उपर्युक्त में से कौन-से सर्वाधिक तार्किक एवं तर्कसंगत कथन हैं जो कि इस आलेख से बनाए जा सकते हैं?
Read this question in English
Directions for the following 2 (two) items: Consider the following graph in which the birthrate and death rate of a country are given, and answer the two items that follow.
With reference to the above graph, consider the following statements considering 1970 as base year:
1. Population has stabilized after 35 years.
2. Population growth rate has stabilized after 35 years.
3. Death rate has fallen by 10% in the first 10 years.
4. Birthrate has stabilized after 35 years.
Which of the above are the most logical and rational statements that can be made from the above graph?
(a) 1 and 2 only · (b) 1, 2 and 3 · (c) 3 and 4 · (d) 2 and 4
उत्तर और व्याख्या · explanation in English
Answer: (d) 2 और 4
From 2005 (35 years after 1970) both curves flatten — the birthrate near 18 and the death rate near 6.5–7 — so the birthrate and the growth rate (their gap) have stabilised. The population itself keeps growing, and the death rate fell by much more than 10% in 1970–80.
- 35 years after 1970 is 2005; compare the curves from 2005 to 2010.
- Birthrate: about 18 throughout; death rate: about 6.5 to 7; gap about 11 throughout.
- 1970–80: death rate from 25 to about 21, a fall of about 16%.
- ✗ 1. Births stay well above deaths after 2005, so the population keeps growing; only its growth rate is steady.
- ✓ 2. After 2005 the gap between the curves stays at about 11 per thousand, so the growth rate has stabilised.
- ✗ 3. The death rate falls from 25 to about 21 per thousand in 1970–80, about 16% (4 points), not 10%.
- ✓ 4. The birthrate curve runs flat at about 18 per thousand from 2005 to 2010.
Remember · A steady growth rate is not a steady population; population stops growing only when births equal deaths.
Question and answer: UPSC's official GS Paper II (2018, Series A) — paper ↗ · answer key ↗. Explanation: Minimalist IAS, checked 1 Oct 2026 (how we verify). ·