चित्र A और B में एक फर्म में श्रमिकों की प्रति वर्ष औसत प्रति घंटा आय (E) निरूपित की गई है :
| वर्ष | 2013 | 2014 | 2015 | 2016 | 2017 |
|---|---|---|---|---|---|
| चित्र A में E | 20 | 25 | 30 | 35 | 40 |
| चित्र B में E | 20 | 25 | 30 | 35 | 40 |
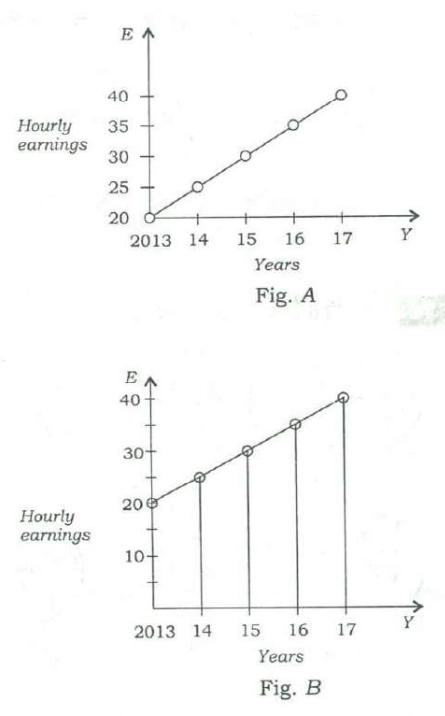
चित्रों से यह देखा जा सकता है कि
Read this question in English
Average hourly earnings per year (E) of the workers in a firm are represented in figures A and B as follows:
From the figures, it is observed that the
(a) values of E are different · (b) ranges (i.e., the difference between the maximum and the minimum) of E are different · (c) slopes of the graphs are same · (d) rates of increase of E are different
उत्तर और व्याख्या · explanation in English
Answer: (c) आलेखों (ग्राफ) की प्रवणता समान है
Both figures plot the same data: E rises from 20 to 40 by 5 each year. Only the axis scales differ, making one line look steeper; the actual slope — 5 per year — is the same in both.
- Fig. A: E = 20, 25, 30, 35, 40 for 2013–17; Fig. B shows the same points on a differently scaled axis.
- (a) The values are identical — false.
- (b) The range is 40 − 20 = 20 in both — false.
- (d) E rises by 5 a year in both — false.
- (c) Slope = change in E per year = 5 in both — true; the visual difference comes only from the scale.
Remember · Before comparing graphs, read the axis scales; stretching an axis changes how steep a line looks, not the data.
Question and answer: UPSC's official GS Paper II (2018, Series A) — paper ↗ · answer key ↗. Explanation: Minimalist IAS, checked 1 Oct 2026 (how we verify). ·