Consider the following figures A and B:
| No. of pieces | Cost of production (₹ in lakhs), Fig. A | Selling price per piece (₹), Fig. B |
|---|---|---|
| 1000 | 6 | 400 |
| 2000 | 7 | 350 |
| 3000 | 8 | 300 |
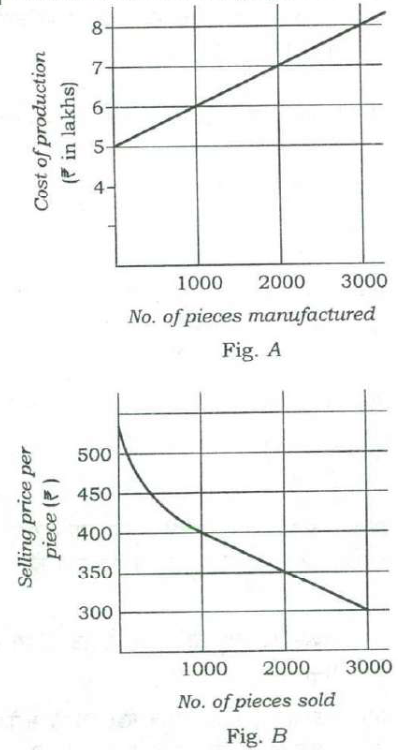
The manufacturing cost and projected sales for a product are shown in the above figures A and B respectively. What is the minimum number of pieces that should be manufactured to avoid a loss?
Answer & explanation
Answer: (a) 2000
Revenue is pieces × price. At 1000 pieces it is ₹4 lakh against a cost of ₹6 lakh; at 2000 pieces it is 2000 × ₹350 = ₹7 lakh, exactly the cost. So 2000 pieces is the minimum that avoids a loss.
- 1000 pieces: revenue 1000 × 400 = ₹4 lakh; cost ₹6 lakh — a loss of ₹2 lakh.
- 1500 pieces: price about ₹375, revenue about ₹5.6 lakh; cost ₹6.5 lakh — still a loss.
- 2000 pieces: revenue 2000 × 350 = ₹7 lakh; cost ₹7 lakh — no loss (break-even).
- 3000 pieces: revenue 3000 × 300 = ₹9 lakh against ₹8 lakh — a profit, but 2000 already suffices.
- Minimum number to avoid a loss: 2000.
Remember · Break-even: compare revenue (quantity × price) with cost at each point; the first point where revenue reaches cost is the answer.
Question and answer: UPSC's official GS Paper II (2018, Series A) — paper ↗ · answer key ↗. Explanation: Minimalist IAS, checked 1 Oct 2026 (how we verify). ·