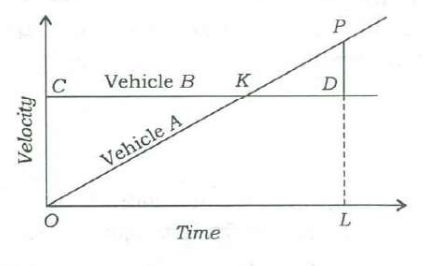
The figure drawn below gives the velocity graphs of two vehicles A and B. The straight line OKP represents the velocity of vehicle A at any instant, whereas the horizontal straight line CKD represents the velocity of vehicle B at any instant. In the figure, D is the point where perpendicular from P meets the horizontal line CKD such that PD = 1/2 LD:
What is the ratio between the distances covered by vehicles A and B in the time interval OL?
Answer & explanation
Answer: (c) 3: 4
Distance is the area under a velocity–time graph. A's distance is the triangle OLP and B's is the rectangle of height LD over OL; since PL = 3/2 × LD, the triangle is 3/4 of the rectangle.
- Let LD (B's constant velocity) = 2 units; then PD = 1 and A's velocity at time L is PL = PD + DL = 3.
- Distance of B in time OL = rectangle = OL × 2 = 2 × OL.
- Distance of A in time OL = triangle OLP = 1/2 × OL × 3 = 1.5 × OL.
- Ratio A : B = 1.5 : 2 = 3 : 4.
Remember · On a velocity–time graph, distance = area under the line: a triangle for steady acceleration from rest, a rectangle for constant speed.
Question and answer: UPSC's official GS Paper II (2018, Series A) — paper ↗ · answer key ↗. Explanation: Minimalist IAS, checked 1 Oct 2026 (how we verify). ·