Consider the following data:
| Year | Birthrate | Death rate |
|---|---|---|
| 1911–1921 | 48·1 | 35·5 |
| 1921–1931 | 46·4 | 36·3 |
| 1931–1941 | 45·2 | 31·2 |
| 1941–1951 | 39·9 | 27·4 |
| 1951–1961 | 41·7 | 22·8 |
| 1961–1971 | 41·1 | 18·9 |
| 1971–1981 | 37·1 | 14·8 |
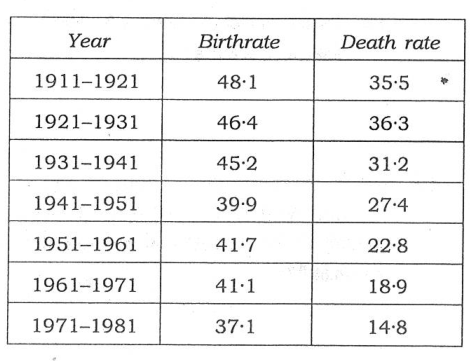
For which period was the natural growth rate maximum?
Answer & explanation
Answer: (d) 1971–1981
Natural growth rate is birth rate minus death rate. The gaps for the four offered periods are 12·6, 12·5, 22·2 and 22·3, so 1971–1981 is the highest, just ahead of 1961–1971.
- 1911–1921: 48·1 − 35·5 = 12·6.
- 1941–1951: 39·9 − 27·4 = 12·5.
- 1961–1971: 41·1 − 18·9 = 22·2.
- 1971–1981: 37·1 − 14·8 = 22·3 — the maximum.
- Check: the periods not offered are lower too (10·1, 14·0, 18·9).
Remember · Natural growth = birth rate − death rate. Compute only the offered periods, and compute the close ones exactly.
Question and answer: UPSC's official GS Paper II (2020, Series A) — paper ↗ · answer key ↗. Explanation: Minimalist IAS, checked 1 Oct 2026 (how we verify). ·