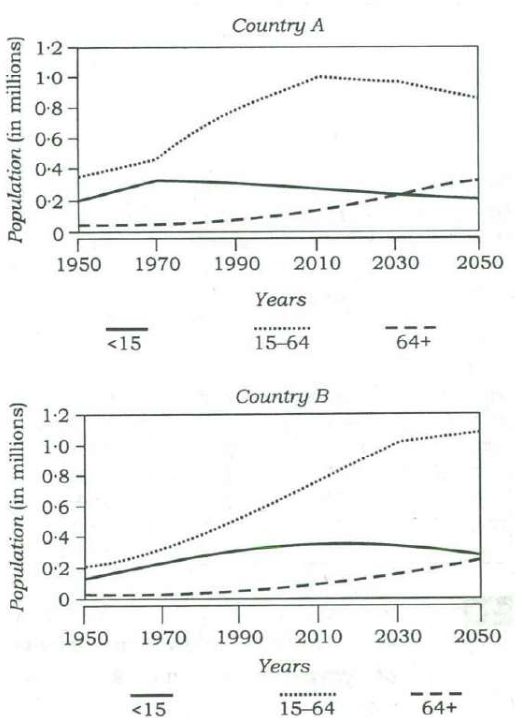
निम्नांकित आलेखों पर विचार कीजिए। आलेखों में दिए गए वक्र कुछ दशकों की अवधि में दो देशों A और B की जनसंख्या में विभिन्न आयु-वर्गों को प्रदर्शित करते हैं :
उपर्युक्त आलेखों के संदर्भ में, निम्नलिखित में से कौन-से सर्वाधिक तार्किक और तर्कसंगत निष्कर्ष (इंफेरेंस) निकाले जा सकते हैं?
- 1.पिछले ढाई दशकों में देश B के निर्भरता अनुपात में कमी आई है।
- 2.अगले ढाई दशकों के अंत में, देश A का निर्भरता अनुपात, देश B के निर्भरता अनुपात की तुलना में बहुत कम हो जाएगा।
- 3.अगले दो दशकों में, देश A की तुलना में देश B में कुल जनसंख्या के सापेक्ष कार्यशील जनसंख्या बढ़ जाएगी।
नीचे दिए गए कूट का प्रयोग कर सही उत्तर चुनिए।
Read this question in English
Consider the following graphs. The curves in the graphs indicate different age groups in the populations of two countries A and B over a period of few decades:
With reference to the above graphs, which of the following are the most logical and rational inferences that can be made?
1. Over the last two and a half decades, the dependency ratio for country B has decreased.
2. By the end of next two and a half decades, the dependency ratio of country A will be much less than that of country B.
3. In the next two decades, the work-force relative to its total population will increase in country B as compared to country A.
Select the correct answer using the code given below.
(a) 1 and 2 only · (b) 2 and 3 only · (c) 1 and 3 only · (d) 1, 2 and 3
उत्तर और व्याख्या · explanation in English
Answer: (c) केवल 1 और 3
Dependency ratio = (under-15 + over-64) ÷ working-age (15–64). In B the working-age group grew much faster than the dependants over the past 25 years, so the ratio fell (1). Ahead, A's working-age group shrinks while its elderly grow, so A's ratio will not be much lower than B's (2 fails), and B's working-age share rises while A's falls (3).
- Dependency ratio = (<15 + 64+) ÷ (15–64).
- Country B, about 1990: (0.32 + 0.05) ÷ 0.54 ≈ 0.69; about 2015: (0.36 + 0.11) ÷ 0.84 ≈ 0.56 — decreased.
- Around 2043: A ≈ (0.23 + 0.31) ÷ 0.92 ≈ 0.59; B ≈ (0.32 + 0.22) ÷ 1.07 ≈ 0.50 — A's ratio is higher, not much lower.
- Working-age share, about 2018 → 2038: B ≈ 0.65 → 0.67 (up); A ≈ 0.68 → 0.65 (down).
- ✓ 1. In B the 15–64 group grows from about 0.54 to 0.84 million over the period while dependants rise only from about 0.37 to 0.47, so the ratio falls.
- ✗ 2. By the early 2040s A's elderly have overtaken its children and its working-age group is shrinking; its ratio (about 0.59) is above B's (about 0.50).
- ✓ 3. B's working-age group keeps growing faster than its dependants, while A's working-age group declines and its elderly grow.
Remember · Dependency ratio = (children + elderly) ÷ working-age; read all three curves at both dates before judging the direction.
Question and answer: UPSC's official GS Paper II (2018, Series A) — paper ↗ · answer key ↗. Explanation: Minimalist IAS, checked 1 Oct 2026 (how we verify). ·